
Problem
In previous editions of the National Building Code of Canada (NBC) climatic data provided in Table C-2 in Appendix C were based on historical weather observations collected and analyzed by Environment and Climate Change Canada (ECCC). It was assumed that climatic data were time-independent (or stationary). However, in the face of extensive evidence that the climate is changing across Canada, this practice raises real safety concerns for the design of buildings.
To assess the impacts of climate change trends on the climatic data and their associated climatic loads and load combinations specified in the NBC, future climatic data sets have been developed by ECCC [1] based on the current body of research in climate modelling. These models simulate how the climate statistics are likely to change in various regions of Canada between 2024 and 2100 under various greenhouse gas (GHG) emissions scenarios called representative concentration pathways (RCPs). An RCP is a greenhouse gas concentration time profile. Four RCPs were used for the Intergovernmental Panel on Climate Change (IPCC) Fifth Assessment Report (AR5) in 2014: RCP2.6, RCP4.5, RCP6 and RCP8.5 (corresponding to radiative forcing values of 2.6 W/m2, 4.5 W/m2, 6 W/m2 and 8.5 W/m2, respectively, in 2100). These pathways represent different future greenhouse gas concentration time profiles that are possible depending on the volume of greenhouse gases emitted.
There has been international recognition in recent decades that the earth’s climate is changing, with the potential to create higher structural loads and more adverse environmental conditions than currently specified based on historical observations. The consequences of this pose an increased risk to building structural integrity and functionality, and occupant life safety. More frequent high-heat events also increase risk to occupant life safety.
In addition to the need to update NBC Table C-2 to account for climate change effects, it was recognized that the current approach to establishing design wind and snow loads, referred to as the "uniform hazard" approach, does not result in uniform reliability of building performance across the country. In order to harmonize performance expectations of buildings under these load effects, a new methodology is proposed to define the climatic loads, called the "uniform risk" approach, in which the ultimate load is specified directly with an implied load factor of 1.0, similar to current earthquake design practice.
Justification
The results of targeted research conducted by ECCC [1] specifically designed to address the effect of future projections of climatic conditions were accounted for in the update of each parameter of NBC Table C-2. The proposed approach for building design is based on a 50-year time horizon (from 2025 to 2075) and the RCP8.5 future emissions scenario, corresponding to a 2.5°C global warming compared to the 1986-2016 baseline period. The projected future values are applied to the parameters in NBC Table C-2 using the following approach.
For parameters used for structural and building envelope design, such as the effects of snow, rain, wind and moisture, if the projected future value in the 50-year time horizon is greater than the current updated value calculated from historical observations, the projected value is used. If the future value is projected to decrease, the current value is retained. This approach, called the "Minimax Method," assures that over the 50-year time horizon the annual risk of failure does not exceed that which has historically been considered as acceptable. For some variables, such as temperature, the governing case for design may be the minimum, while for others, such as wind and snow, it is the maximum. For instance, for wind, projections mostly show increases in reference pressure in the future, making the last year of service life the governing case; for snow, projections mostly show decreases in snow load in the future, making the first year of service life the worst case. This is deemed an appropriate approach that ensures that the NBC Table C-2 values reflect the maximum loads expected that correspond to the specified annual probability of exceedance.
The non-stationarity of future climate due to the impact of climate change is embedded in NBC Table C-2 using climate change factors derived from regional averages using the Minimax approach [2], [3]. For reference design wind pressures, most areas in Canada have a climate change factor of 1.05, while locations in Ontario, the Atlantic provinces and west of 120°W in British Columbia have a climate change factor of 1.1. For ground snow loads, excepting the northern territories where a climate change factor of 1.05 applies, most regions have a climate change factor of 1.0, as the governing scenario is based on the present climate. The Minimax approach to adopt future values is also applied to the other parameters, using the future change factors from the targeted research results. For some parameters, such as the one-day and 15-minute rainfalls, there are increases at all locations. For the moisture index, future values are applied at locations where the moisture load increases, and the values remain unchanged elsewhere.
In future updates of NBC Table C-2 values, it is expected that current values at that time will be updated to a new baseline period. Projected future values, based on ongoing research, will also be updated and referenced to the same new baseline period. In this way, both the current and future values will be reset to reflect current knowledge at the time of the future update, and the future values using the Minimax Method for this update will not be compounded in future updates.
Terminology is also affected by the effects of a changing climate. Low-probability events have often been described as having a return period which, in a stationary (non-changing) climate, is defined as the average interval in years between such events. The reciprocal of the return period is defined as the annual exceedance probability. For instance, a 50-year return period event has an annual probability of 1/50 or 0.02. In a changing climate, the definition of the return period as an interval between events is not accurate. As a result, low-probability events are now identified with their annual exceedance probability rather than return period, since the annual probability can and often will change over time. For instance, a 50-year return period event is now described as a "1/50 annual probability event," or sometimes just as the "1/50 value."
The uniform risk approach for wind results in a new 1/500 annual probability wind pressure value to reflect the ultimate load. In thunderstorm-prone regions, for wind values at low probabilities such as 1/500, the separate analysis of convective (e.g., thunderstorm) and synoptic (e.g., active low-pressure system with an embedded weather front) wind events generally results in higher wind values than the usual (up to the 2020 edition of the NBC) approach of analyzing the commingled convective and synoptic wind events as a single data set. This effect is not significant at higher annual probabilities, such as 1/10 and 1/50. In addition to future values applied with the Minimax approach, the 500-year wind pressure values also account for the separate analysis of convective and synoptic wind events.
For parameters related to temperature and heating and cooling loads, such as degree-days below 18°C and 15°C, and January and July design temperatures, future values corresponding to a 50-year time horizon and RCP8.5 emissions scenario are applied in a similarly appropriate approach. Since warming is projected to occur for all locations, the current values for degree-day data and January design temperatures are all retained.
Analysis of the energy performance of buildings does not indicate an increased risk of overheating in buildings when cooling systems are provided and sized using historical July temperature data, in the context of a future climate scenario.
However, sizing mechanical cooling systems based on future 50-year July temperature projections could result in oversized cooling equipment, which could increase construction costs. Also, the equipment may never experience the elevated temperature condition during its service life, which is considerably less than 50 years. Oversized cooling equipment can decrease energy efficiency and increase energy costs. The resulting oversizing could make equipment short-cycling worse and lead to inability of the equipment to meet latent loads, resulting in potentially excessive indoor humidity levels. In addition, short-cycling will decrease the service life of equipment. For the purpose of cooling system equipment design, NBC Table C-2 provides July temperature data based on historical observations.
Further work is proposed on the use of future climatic data in energy codes.
Extensive changes to the climatic design data in NBC Table C-2 and related documentation in NBC Appendix C implement the approach described above.
References
[1] Cannon, A.J., Jeong, D.I., Zhang, X., and Zwiers, F. W. Climate-Resilient Buildings and Core Public Infrastructure: An Assessment of the Impact of Climate Change on Climatic Design Data in Canada. Environment and Climate Change Canada, Ottawa, ON, 2020.
[2] Hong, H.P., Tang, Q., Yang, S.C., Cui, X.Z., Cannon, A.J., Lounis, Z., and Irwin, P. Calibration of the design wind load and snow load considering the historical climate statistics and climate change effects. Structural Safety, Vol. 93, 10213, 2021.
[3] Li, S.H., Irwin, P., Lounis, Z., Attar, A., Dale, J., Gibbons, M., and Beaulieu, S. Effects of Nonstationarity of Extreme Wind Speeds and Ground Snow Loads in a Future Canadian Changing Climate. Natural Hazards Review, Vol. 23, No. 4, 04022022, 2022.
PROPOSED CHANGE
- The depth of snow on the ground
, which hashaving an annual probability of exceedance of 1-in-50,is computed. - The appropriate specific weight is selected and used to convert snow depth to loads, Ss.
- The load, Sr, which is due to rain falling on the snow, is computed.
- Because the accumulation of snow on roofs is often different from that on the ground, adjustments are applied to the ground snow load to provide a design snow load on a roof.
Derivation of moisture index (MI) based on normalized values for wetting index (WI) and drying index (DI)

| Province and Location | Elev., m | Design Temperature | Degree-Days Below 18°C | Degree-Days Below 15°C | 15 Min. Rain, mm | One Day Rain, 1/50, mm | Ann. Rain, mm | Moist. Index | Ann. Tot. Ppn., mm | Driving Rain Wind Pressures, Pa, 1/5 | Snow Load, kPa, 1/50 | Snow Load, kPa, 1/1000 | Hourly Wind Pressures, kPa | Winter Average | ||||||||||
| January | July 2.5% | Ss | Sr | Ss | Sr | 1/10 | 1/50 | 1/500 | Temperature, °C | Wind Speed, m/s | ||||||||||||||
| 2.5% °C | 1% °C | HistoricalPROPOSED CHANGE Table C-2. Footnote (1) | Future | |||||||||||||||||||||
| Dry °C | Wet °C | Dry °C | Wet °C | |||||||||||||||||||||
| British Columbia | ||||||||||||||||||||||||
|
100 Mile House
|
1040 | -30 | -32 | 29 | 17 | 34 | 21 | 5030 | 4040 | 0.4 | 2.6 | 0.3 | 3.7 | 0.4 | 0.55 | -7 | 2.8 | |||||||
|
Abbotsford
|
70 | -8 | -10 | 29 | 20 | 35 | 25 | 2860 | 2000 | 1.6 | 2 | 0.3 | 3.2 | 0.5 | 0.68 | -3 | 3.7 | |||||||
|
Agassiz
|
15 | -9 | -11 | 31 | 21 | 37 | 26 | 2750 | 1900 | 2.4 | 0.7 | 3.8 | 1.1 | 0.77 | -4 | 5.1 | ||||||||
|
Alberni
|
12 | -5 | -8 | 31 | 19 | 37 | 24 | 3100 | 2220 | 2.6 | 0.4 | 4.2 | 0.6 | 0.5 | -2 | 1 | ||||||||
|
Ashcroft
|
305 | -24 | -27 | 34 | 20 | 39 | 24 | 3700 | 2790 | 0.3 | 1.7 | 0.1 | 2.5 | 0.2 | 0.61 | -5 | 1.1 | |||||||
|
Bamfield
|
20 | -2 | -4 | 23 | 17 | 28 | 21 | 3080 | 2060 | 1 | 0.4 | 1.6 | 0.7 | 0.77 | -2 | 2 | ||||||||
|
Beatton River
|
840 | -37 | -39 | 26 | 18 | 31 | 22 | 6300 | 5230 | 0.5 | 3.3 | 0.1 | 4.6 | 0.1 | 0.47 | -12 | 2.5 | |||||||
|
Bella Bella
|
25 | -5 | -7 | 23 | 18 | 28 | 22 | 3180 | 2150 | 2.6 | 0.8 | 4.2 | 1.3 | 0.73 | -2 | 2.5 | ||||||||
|
Bella Coola
|
40 | -14 | -18 | 27 | 19 | 33 | 24 | 3560 | 2660 | 4.5 | 0.8 | 7 | 1.2 | 0.61 | -3 | 2.1 | ||||||||
|
Burns Lake
|
755 | -31 | -34 | 26 | 17 | 32 | 22 | 5450 | 4430 | 0.6 | 3.4 | 0.2 | 4.8 | 0.3 | 0.64 | -8 | 1 | |||||||
|
Cache Creek
|
455 | -24 | -27 | 34 | 20 | 39 | 24 | 3700 | 2790 | 0.3 | 1.7 | 0.2 | 2.5 | 0.3 | 0.64 | -5 | 1.1 | |||||||
|
Campbell River
|
20 | -5 | -7 | 26 | 18 | 32 | 23 | 3000 | 2130 | 2.8 | 0.4 | 4.5 | 0.7 | 0.65 | -3 | 2 | ||||||||
|
Carmi
|
845 | -24 | -26 | 31 | 19 | 36 | 23 | 4750 | 3770 | 3.6 | 0.2 | 5.2 | 0.3 | 0.58 | -4 | 2.5 | ||||||||
|
Castlegar
|
430 | -18 | -20 | 32 | 20 | 37 | 24 | 3580 | 2680 | 4.2 | 0.1 | 6 | 0.1 | 0.52 | -4 | 2 | ||||||||
|
Chetwynd
|
605 | -35 | -38 | 27 | 18 | 33 | 22 | 5500 | 4480 | 0.6 | 2.4 | 0.2 | 3.5 | 0.3 | 0.65 | -9 | 2.2 | |||||||
|
Chilliwack
|
10 | -9 | -11 | 30 | 20 | 36 | 25 | 2780 | 1920 | 2.2 | 0.3 | 3.5 | 0.5 | 0.74 | -4 | 4.5 | ||||||||
|
Comox
|
15 | -7 | -9 | 27 | 18 | 33 | 23 | 2930 | 2220 | 2.4 | 0.4 | 3.8 | 0.6 | 0.65 | -2 | 2.1 | ||||||||
|
Courtenay
|
10 | -7 | -9 | 28 | 18 | 34 | 23 | 2930 | 2220 | 2.4 | 0.4 | 3.8 | 0.6 | 0.65 | -2 | 2.1 | ||||||||
|
Cranbrook
|
910 | -26 | -28 | 32 | 18 | 37 | 22 | 4400 | 3450 | 0.3 | 3 | 0.2 | 4.4 | 0.3 | 0.53 | -7 | 1.6 | |||||||
|
Crescent Valley
|
585 | -18 | -20 | 31 | 20 | 36 | 24 | 3650 | 2740 | 4.2 | 0.1 | 6 | 0.1 | 0.51 | -4 | 2.2 | ||||||||
|
Crofton
|
5 | -4 | -6 | 28 | 19 | 34 | 24 | 2880 | 2020 | 1.8 | 0.2 | 2.9 | 0.3 | 0.58 | -2 | 1 | ||||||||
|
Dawson Creek
|
665 | -38 | -40 | 27 | 18 | 32 | 22 | 5900 | 4860 | 0.5 | 2.5 | 0.2 | 3.6 | 0.3 | 0.65 | -11 | 2.2 | |||||||
|
Dease Lake
|
800 | -37 | -40 | 24 | 15 | 29 | 19 | 6730 | 5630 | 0.6 | 2.8 | 0.1 | 3.9 | 0.1 | 0.45 | -11 | 1.9 | |||||||
|
Dog Creek
|
450 | -28 | -30 | 29 | 17 | 34 | 21 | 4800 | 3820 | 0.4 | 1.8 | 0.2 | 2.7 | 0.3 | 0.55 | -7 | 2.9 | |||||||
|
Duncan
|
10 | -6 | -8 | 28 | 19 | 33 | 24 | 2980 | 2110 | 1.8 | 0.4 | 2.9 | 0.6 | 0.57 | -2 | 1 | ||||||||
|
Elko
|
1065 | -28 | -31 | 30 | 19 | 35 | 23 | 4600 | 3630 | 0.5 | 3.6 | 0.2 | 5.3 | 0.3 | 0.62 | -8 | 2 | |||||||
|
Fernie
|
1010 | -27 | -30 | 30 | 19 | 35 | 23 | 4750 | 3770 | 0.9 | 4.5 | 0.2 | 6.5 | 0.3 | 0.65 | -8 | 2.2 | |||||||
|
Fort Nelson
|
465 | -39 | -42 | 28 | 18 | 32 | 22 | 6710 | 5740 | 0.6 | 2.4 | 0.1 | 3.3 | 0.1 | 0.47 | -13 | 1.8 | |||||||
|
Fort St. John
|
685 | -35 | -37 | 26 | 18 | 31 | 22 | 5750 | 4710 | 0.5 | 2.8 | 0.1 | 4.1 | 0.1 | 0.64 | -11 | 3.9 | |||||||
|
Glacier
|
1145 | -27 | -30 | 27 | 17 | 33 | 22 | 5800 | 4760 | 9.4 | 0.2 | 12.3 | 0.3 | 0.52 | -7 | 1.7 | ||||||||
|
Golden
|
790 | -27 | -30 | 30 | 17 | 36 | 22 | 4750 | 3770 | 0.6 | 3.7 | 0.2 | 5 | 0.3 | 0.58 | -7 | 1.4 | |||||||
|
Gold River
|
120 | -8 | -11 | 31 | 18 | 37 | 23 | 3230 | 2350 | 2.8 | 0.6 | 4.7 | 1 | 0.5 | -2 | 1.8 | ||||||||
|
Grand Forks
|
565 | -19 | -22 | 34 | 20 | 39 | 24 | 3820 | 2900 | 2.8 | 0.1 | 4 | 0.1 | 0.62 | -4 | 2 | ||||||||
|
Greenwood
|
745 | -20 | -23 | 34 | 20 | 39 | 24 | 4100 | 3160 | 3.6 | 0.1 | 5.2 | 0.1 | 0.62 | -4 | 2 | ||||||||
|
Hope
|
40 | -13 | -15 | 31 | 20 | 37 | 25 | 2820 | 2130 | 2.8 | 0.7 | 4.4 | 1.1 | 1.03 | -4 | 6 | ||||||||
|
Jordan River
|
20 | -1 | -3 | 22 | 17 | 27 | 22 | 2900 | 1900 | 1.2 | 0.4 | 2 | 0.7 | 0.79 | -2 | 2 | ||||||||
|
Kamloops
|
355 | -23 | -25 | 34 | 20 | 38 | 24 | 3450 | 2670 | 0.2 | 1.8 | 0.2 | 2.6 | 0.3 | 0.65 | -6 | 2.9 | |||||||
|
Kaslo
|
545 | -17 | -20 | 30 | 19 | 35 | 23 | 3830 | 2910 | 2.8 | 0.1 | 4 | 0.1 | 0.51 | -5 | 1.8 | ||||||||
|
Kelowna
|
350 | -17 | -20 | 33 | 20 | 38 | 24 | 3400 | 2510 | 0.3 | 1.7 | 0.1 | 2.5 | 0.2 | 0.62 | -5 | 1.6 | |||||||
|
Kimberley
|
1090 | -25 | -27 | 31 | 18 | 36 | 22 | 4650 | 3680 | 0.4 | 3 | 0.2 | 4.3 | 0.3 | 0.53 | -7 | 1.6 | |||||||
|
Kitimat Plant
|
15 | -16 | -18 | 25 | 16 | 31 | 21 | 3750 | 2830 | 5.5 | 0.8 | 8.4 | 1.2 | 0.75 | -5 | 5 | ||||||||
|
Kitimat Townsite
|
130 | -16 | -18 | 24 | 16 | 30 | 21 | 3900 | 2980 | 6.5 | 0.8 | 9.8 | 1.2 | 0.75 | -5 | 5 | ||||||||
|
Ladysmith
|
80 | -7 | -9 | 27 | 19 | 32 | 24 | 2920 | 2130 | 2.4 | 0.4 | 3.9 | 0.7 | 0.58 | -2 | 1.5 | ||||||||
|
Langford
|
80 | -4 | -6 | 27 | 19 | 33 | 23 | 2750 | 1770 | 1.8 | 0.3 | 3 | 0.5 | 0.58 | -2 | 3.3 | ||||||||
|
Lillooet
|
245 | -21 | -23 | 34 | 20 | 39 | 24 | 3400 | 2610 | 0.3 | 2.1 | 0.1 | 3.2 | 0.2 | 0.72 | -5 | 2 | |||||||
|
Lytton
|
325 | -17 | -20 | 35 | 20 | 40 | 24 | 3300 | 2410 | 0.3 | 2.8 | 0.3 | 4.3 | 0.5 | 0.7 | -5 | 1.7 | |||||||
|
Mackenzie
|
765 | -34 | -38 | 27 | 17 | 33 | 21 | 5550 | 4530 | 0.5 | 5.1 | 0.2 | 7.1 | 0.3 | 0.5 | -8 | 1.6 | |||||||
|
Masset
|
10 | -5 | -7 | 17 | 15 | 21 | 18 | 3700 | 2600 | 1.8 | 0.4 | 2.9 | 0.6 | 0.86 | -2 | 1.7 | ||||||||
|
McBride
|
730 | -29 | -32 | 29 | 18 | 36 | 23 | 4980 | 3990 | 0.6 | 4.3 | 0.2 | 6.2 | 0.3 | 0.58 | -9 | 2 | |||||||
|
McLeod Lake
|
695 | -35 | -37 | 27 | 17 | 33 | 21 | 5450 | 4430 | 0.5 | 4.1 | 0.2 | 5.7 | 0.3 | 0.5 | -8 | 2 | |||||||
|
Merritt
|
570 | -24 | -27 | 34 | 20 | 39 | 24 | 3900 | 2980 | 0.2 | 1.8 | 0.3 | 2.7 | 0.4 | 0.72 | -6 | 1.1 | |||||||
|
Mission City
|
45 | -9 | -11 | 30 | 20 | 36 | 25 | 2850 | 1990 | 1.7 | 2.4 | 0.3 | 3.8 | 0.5 | 0.67 | -3 | 4 | |||||||
|
Montrose
|
615 | -16 | -18 | 32 | 20 | 37 | 24 | 3600 | 2690 | 4.1 | 0.1 | 5.8 | 0.1 | 0.55 | -4 | 1.5 | ||||||||
|
Nakusp
|
445 | -20 | -22 | 31 | 20 | 36 | 24 | 3560 | 2660 | 4.4 | 0.1 | 6.2 | 0.1 | 0.51 | -4 | 1.2 | ||||||||
|
Nanaimo
|
15 | -6 | -8 | 27 | 19 | 33 | 24 | 2920 | 2130 | 2.1 | 0.4 | 3.5 | 0.7 | 0.7 | -2 | 3 | ||||||||
|
Nelson
|
600 | -18 | -20 | 31 | 20 | 36 | 24 | 3500 | 2600 | 4.2 | 0.1 | 5.9 | 0.1 | 0.51 | -4 | 2.3 | ||||||||
|
Ocean Falls
|
10 | -10 | -12 | 23 | 17 | 28 | 22 | 3400 | 2510 | 3.9 | 0.8 | 6.2 | 1.3 | 0.92 | -3 | 2.1 | ||||||||
|
Osoyoos
|
285 | -14 | -17 | 35 | 21 | 40 | 25 | 3100 | 2220 | 0.3 | 1.1 | 0.1 | 1.6 | 0.2 | 0.62 | -4 | 1.8 | |||||||
|
Parksville
|
40 | -6 | -8 | 26 | 19 | 32 | 24 | 2990 | 2320 | 2 | 0.4 | 3.2 | 0.7 | 0.66 | -2 | 2 | ||||||||
|
Penticton
|
350 | -15 | -17 | 33 | 20 | 38 | 24 | 3350 | 2460 | 0.3 | 1.3 | 0.1 | 1.9 | 0.2 | 0.62 | -4 | 3.4 | |||||||
|
Port Alberni
|
15 | -5 | -8 | 31 | 19 | 37 | 24 | 3100 | 2220 | 2.6 | 0.4 | 4.2 | 0.6 | 0.5 | -2 | 1 | ||||||||
|
Port Alice
|
25 | -3 | -6 | 26 | 17 | 31 | 21 | 3010 | 2000 | 1.1 | 0.4 | 1.8 | 0.7 | 0.5 | -2 | 1.5 | ||||||||
|
Port Hardy
|
5 | -5 | -7 | 20 | 16 | 25 | 20 | 3440 | 2370 | 0.9 | 0.4 | 1.5 | 0.7 | 0.75 | -2 | 2.8 | ||||||||
|
Port McNeill
|
5 | -5 | -7 | 22 | 17 | 27 | 21 | 3410 | 2350 | 1.1 | 0.4 | 1.8 | 0.7 | 0.75 | -2 | 2.8 | ||||||||
|
Port Renfrew
|
20 | -3 | -5 | 24 | 17 | 29 | 21 | 2900 | 1900 | 1.1 | 0.4 | 1.8 | 0.7 | 0.75 | -2 | 2.5 | ||||||||
|
Powell River
|
10 | -7 | -9 | 26 | 18 | 32 | 23 | 3100 | 2220 | 1.7 | 0.4 | 2.7 | 0.6 | 0.68 | -2 | 1.2 | ||||||||
|
Prince George
|
580 | -32 | -36 | 28 | 18 | 34 | 22 | 4720 | 3750 | 3.4 | 0.2 | 4.8 | 0.3 | 0.63 | -8 | 3 | ||||||||
|
Prince Rupert
|
20 | -13 | -15 | 19 | 15 | 24 | 19 | 3900 | 2770 | 1.9 | 0.4 | 2.9 | 0.6 | 0.78 | -3 | 2.5 | ||||||||
|
Princeton
|
655 | -24 | -29 | 33 | 19 | 39 | 24 | 4250 | 3300 | 0.4 | 2.9 | 0.6 | 4.3 | 0.9 | 0.59 | -6 | 1 | |||||||
|
Qualicum Beach
|
10 | -7 | -9 | 27 | 19 | 33 | 24 | 2990 | 2320 | 2 | 0.4 | 3.3 | 0.7 | 0.65 | -2 | 2 | ||||||||
|
Queen Charlotte City
|
35 | -6 | -8 | 21 | 16 | 25 | 20 | 3520 | 2440 | 1.8 | 0.4 | 2.9 | 0.6 | 0.86 | -2 | 2 | ||||||||
|
Quesnel
|
475 | -31 | -33 | 30 | 17 | 36 | 21 | 4650 | 3680 | 3 | 0.1 | 4.4 | 0.2 | 0.51 | -7 | 1.8 | ||||||||
|
Revelstoke
|
440 | -20 | -23 | 31 | 19 | 36 | 23 | 4000 | 3070 | 7.2 | 0.1 | 9.9 | 0.1 | 0.52 | -5 | 1.7 | ||||||||
|
Salmon Arm
|
425 | -19 | -24 | 33 | 21 | 38 | 25 | 3650 | 2740 | 3.5 | 0.1 | 4.9 | 0.1 | 0.61 | -5 | 1.1 | ||||||||
|
Sandspit
|
5 | -4 | -6 | 18 | 15 | 22 | 19 | 3450 | 2380 | 1.8 | 0.4 | 2.9 | 0.7 | 1.01 | -2 | 6.3 | ||||||||
|
Sechelt
|
25 | -6 | -8 | 27 | 20 | 33 | 25 | 2680 | 1830 | 1.8 | 0.4 | 3 | 0.7 | 0.7 | -2 | 1.4 | ||||||||
|
Sidney
|
10 | -4 | -6 | 26 | 18 | 32 | 22 | 2850 | 1860 | 1.1 | 0.2 | 1.8 | 0.3 | 0.61 | -2 | 3.3 | ||||||||
|
Smithers
|
500 | -29 | -31 | 26 | 17 | 32 | 22 | 5040 | 4050 | 0.6 | 3.5 | 0.2 | 4.9 | 0.3 | 0.62 | -7 | 1.7 | |||||||
|
Smith River
|
660 | -45 | -47 | 26 | 17 | 30 | 21 | 7100 | 5980 | 0.6 | 40 | 2.8 | 0.1 | 3.9 | 0.1 | 0.46 | -14 | 1.9 | ||||||
|
Sooke
|
20 | -1 | -3 | 21 | 16 | 27 | 20 | 2900 | 1900 | 1.3 | 0.3 | 2.2 | 0.5 | 0.7 | -2 | 2 | ||||||||
|
Squamish
|
5 | -9 | -11 | 29 | 20 | 35 | 25 | 2950 | 2080 | 2.8 | 0.7 | 4.3 | 1.1 | 0.77 | -3 | 3 | ||||||||
|
Stewart
|
10 | -17 | -20 | 25 | 16 | 31 | 21 | 4350 | 3400 | 7.9 | 0.8 | 11.4 | 1.2 | 0.56 | -7 | 2 | ||||||||
|
Tahsis
|
25 | -4 | -6 | 26 | 18 | 32 | 23 | 3150 | 2120 | 1.1 | 0.4 | 1.8 | 0.7 | 0.52 | -2 | 1 | ||||||||
|
Taylor
|
515 | -35 | -37 | 26 | 18 | 31 | 22 | 5720 | 4690 | 0.5 | 2.3 | 0.1 | 3.3 | 0.2 | 0.65 | -11 | 3.9 | |||||||
|
Terrace
|
60 | -19 | -21 | 27 | 17 | 33 | 22 | 4150 | 3210 | 5.4 | 0.6 | 8 | 0.9 | 0.56 | -5 | 5.2 | ||||||||
|
Tofino
|
10 | -2 | -4 | 20 | 16 | 25 | 20 | 3150 | 2120 | 1.1 | 0.4 | 1.8 | 0.7 | 1.06 | -2 | 1.5 | ||||||||
|
Trail
|
440 | -14 | -17 | 33 | 20 | 38 | 24 | 3600 | 2690 | 4.1 | 0.1 | 5.7 | 0.1 | 0.55 | -4 | 1.5 | ||||||||
|
Ucluelet
|
5 | -2 | -4 | 18 | 16 | 23 | 20 | 3120 | 2100 | 1 | 0.4 | 1.7 | 0.7 | 1.06 | -2 | 1.5 | ||||||||
|
Vancouver Region
|
||||||||||||||||||||||||
|
Burnaby (Simon Fraser Univ.)
|
330 | -7 | -9 | 25 | 17 | 31 | 22 | 3100 | 2220 | 2.9 | 0.7 | 4.7 | 1.1 | 0.74 | -3 | 2.9 | ||||||||
|
Cloverdale
|
10 | -8 | -10 | 29 | 20 | 35 | 25 | 2700 | 1850 | 1.4 | 2.5 | 0.2 | 4 | 0.3 | 0.68 | -3 | 1.7 | |||||||
|
Haney
|
10 | -9 | -11 | 30 | 20 | 36 | 25 | 2840 | 1980 | 2.4 | 0.2 | 3.9 | 0.3 | 0.68 | -3 | 1.7 | ||||||||
|
Ladner
|
3 | -6 | -8 | 27 | 19 | 33 | 24 | 2600 | 1750 | 1.3 | 0.2 | 2.1 | 0.3 | 0.66 | -3 | 1.7 | ||||||||
|
Langley
|
15 | -8 | -10 | 29 | 20 | 35 | 25 | 2700 | 1850 | 1.5 | 2.4 | 0.2 | 3.9 | 0.3 | 0.68 | -3 | 1.7 | |||||||
|
New Westminster
|
10 | -8 | -10 | 29 | 19 | 35 | 24 | 2800 | 1940 | 2.3 | 0.2 | 3.7 | 0.3 | 0.68 | -3 | 1.7 | ||||||||
|
North Vancouver
|
135 | -7 | -9 | 26 | 19 | 32 | 24 | 2910 | 2050 | 3 | 0.3 | 4.7 | 0.5 | 0.69 | -3 | 1 | ||||||||
|
Richmond
|
5 | -7 | -9 | 27 | 19 | 33 | 24 | 2800 | 1940 | 1.5 | 0.2 | 2.4 | 0.3 | 0.65 | -3 | 2.5 | ||||||||
|
Surrey (88 Ave & 156 St.)
|
90 | -8 | -10 | 29 | 20 | 35 | 25 | 2750 | 1900 | 1.6 | 2.4 | 0.3 | 3.8 | 0.5 | 0.68 | -3 | 1.7 | |||||||
|
Vancouver (City Hall)
|
40 | -7 | -9 | 28 | 20 | 34 | 25 | 2825 | 1970 | 1.8 | 0.2 | 2.9 | 0.3 | 0.69 | -3 | 2.5 | ||||||||
|
Vancouver (Granville St. & 41st Ave)
|
120 | -6 | -8 | 28 | 20 | 34 | 25 | 2925 | 2060 | 1.9 | 0.3 | 3 | 0.5 | 0.65 | -3 | 2.5 | ||||||||
|
West Vancouver
|
45 | -7 | -9 | 28 | 19 | 34 | 24 | 2950 | 2080 | 2.4 | 0.2 | 3.8 | 0.3 | 0.75 | -3 | 2 | ||||||||
|
Vernon
|
405 | -20 | -23 | 33 | 20 | 38 | 24 | 3600 | 2690 | 2.2 | 0.1 | 3.2 | 0.1 | 0.62 | -5 | 1.5 | ||||||||
|
Victoria Region
|
||||||||||||||||||||||||
|
Victoria
|
10 | -4 | -6 | 24 | 17 | 30 | 21 | 2650 | 1730 | 1.1 | 0.2 | 1.8 | 0.3 | 0.81 | -2 | 4.7 | ||||||||
|
Victoria (Gonzales Hts)
|
65 | -4 | -6 | 24 | 17 | 30 | 21 | 2700 | 1690 | 1.5 | 0.3 | 2.5 | 0.5 | 0.81 | -2 | 4.7 | ||||||||
|
Victoria (Mt Tolmie)
|
125 | -6 | -8 | 24 | 16 | 30 | 20 | 2700 | 1730 | 2.1 | 0.3 | 3.5 | 0.5 | 0.78 | -2 | 4 | ||||||||
|
Whistler
|
665 | -17 | -20 | 30 | 20 | 36 | 25 | 4180 | 3240 | 9.5 | 0.9 | 13.9 | 1.3 | 0.5 | -4 | 1 | ||||||||
|
White Rock
|
30 | -5 | -7 | 25 | 20 | 31 | 25 | 2620 | 1770 | 1.2 | 2 | 0.2 | 3.3 | 0.3 | 0.68 | -3 | 1.7 | |||||||
|
Williams Lake
|
615 | -30 | -33 | 29 | 17 | 34 | 21 | 4400 | 3450 | 2.4 | 0.2 | 3.6 | 0.3 | 0.58 | -7 | 2.9 | ||||||||
|
Youbou
|
200 | -5 | -8 | 31 | 19 | 36 | 24 | 3050 | 2180 | 3.5 | 0.7 | 5.6 | 1.1 | 0.45 | -2 | 1 | ||||||||
| Alberta | ||||||||||||||||||||||||
|
Athabasca
|
515 | -35 | -38 | 27 | 19 | 32 | 23 | 6000 | 5000 | 0.6 | 80 | 1.5 | 0.1 | 2.1 | 0.1 | 0.59 | -10 | 2.4 | ||||||
|
Banff
|
1400 | -31 | -33 | 27 | 16 | 33 | 20 | 5500 | 4520 | 0.6 | 3.3 | 0.1 | 4.8 | 0.1 | 0.47 | -8 | 2.3 | |||||||
|
Barrhead
|
645 | -33 | -36 | 27 | 19 | 32 | 23 | 5740 | 4750 | 0.6 | 100 | 1.7 | 0.1 | 2.5 | 0.2 | 0.67 | -11 | 2 | ||||||
|
Beaverlodge
|
730 | -36 | -39 | 28 | 18 | 33 | 22 | 5700 | 4710 | 0.5 | 2.4 | 0.1 | 3.5 | 0.2 | 0.56 | -10 | 2.1 | |||||||
|
Brooks
|
760 | -32 | -34 | 32 | 20 | 37 | 24 | 4880 | 3940 | 0.3 | 1.2 | 0.1 | 1.8 | 0.2 | 0.67 | -10 | 3.8 | |||||||
|
Calgary
|
1045 | -30 | -32 | 28 | 17 | 34 | 21 | 5000 | 4050 | 0.4 | 1.1 | 0.1 | 1.6 | 0.2 | 0.74 | -9 | 3.4 | |||||||
|
Campsie
|
660 | -33 | -36 | 27 | 19 | 32 | 23 | 5750 | 4760 | 0.6 | 100 | 1.7 | 0.1 | 2.5 | 0.2 | 0.72 | -11 | 1.8 | ||||||
|
Camrose
|
740 | -33 | -35 | 29 | 19 | 34 | 23 | 5500 | 4520 | 0.5 | 160 | 2 | 0.1 | 2.9 | 0.1 | 0.6 | -10 | 2.9 | ||||||
|
Canmore
|
1320 | -31 | -33 | 28 | 17 | 34 | 21 | 5400 | 4430 | 0.6 | 3.2 | 0.1 | 4.6 | 0.1 | 0.55 | -8 | 2.3 | |||||||
|
Cardston
|
1130 | -29 | -32 | 30 | 19 | 35 | 23 | 4700 | 3770 | 0.4 | 1.5 | 0.1 | 2.2 | 0.2 | 1.04 | -9 | 4.7 | |||||||
|
Claresholm
|
1030 | -30 | -32 | 30 | 18 | 35 | 22 | 4680 | 3750 | 0.4 | 1.3 | 0.1 | 1.9 | 0.2 | 0.89 | -9 | 3.8 | |||||||
|
Cold Lake
|
540 | -35 | -38 | 28 | 19 | 33 | 23 | 5860 | 4860 | 0.5 | 140 | 1.7 | 0.1 | 2.5 | 0.1 | 0.61 | -11 | 2.8 | ||||||
|
Coleman
|
1320 | -31 | -34 | 29 | 18 | 34 | 22 | 5210 | 4250 | 0.5 | 2.7 | 0.3 | 4 | 0.4 | 0.97 | -8 | 2.7 | |||||||
|
Coronation
|
790 | -32 | -34 | 30 | 19 | 36 | 23 | 5640 | 4660 | 0.5 | 1.9 | 0.1 | 2.8 | 0.2 | 0.55 | -10 | 4.3 | |||||||
|
Cowley
|
1175 | -29 | -32 | 29 | 18 | 34 | 22 | 4810 | 3870 | 0.4 | 1.6 | 0.1 | 2.3 | 0.2 | 1.47 | -9 | 4 | |||||||
|
Drumheller
|
685 | -32 | -34 | 30 | 18 | 36 | 22 | 5050 | 4100 | 0.4 | 1.2 | 0.1 | 1.7 | 0.1 | 0.67 | -10 | 2 | |||||||
|
Edmonton
|
645 | -30 | -33 | 28 | 19 | 34 | 23 | 5120 | 4160 | 0.5 | 1.7 | 0.1 | 2.5 | 0.2 | 0.68 | -10 | 3 | |||||||
|
Edson
|
920 | -34 | -37 | 27 | 18 | 32 | 22 | 5750 | 4760 | 0.6 | 100 | 2.1 | 0.1 | 3 | 0.1 | 0.69 | -9 | 2.2 | ||||||
|
Embarras Portage
|
220 | -41 | -43 | 28 | 19 | 32 | 23 | 7100 | 6040 | 0.6 | 80 | 2.2 | 0.1 | 3 | 0.1 | 0.57 | -14 | 2.9 | ||||||
|
Fairview
|
670 | -37 | -40 | 27 | 18 | 32 | 22 | 5840 | 4850 | 0.5 | 2.4 | 0.1 | 3.5 | 0.2 | 0.55 | -11 | 2.8 | |||||||
|
Fort MacLeod
|
945 | -30 | -32 | 31 | 19 | 36 | 23 | 4600 | 3670 | 0.4 | 1.2 | 0.1 | 1.8 | 0.2 | 0.99 | -9 | 3.8 | |||||||
|
Fort McMurray
|
255 | -38 | -40 | 28 | 19 | 33 | 23 | 6250 | 5230 | 0.5 | 60 | 1.5 | 0.1 | 2.1 | 0.1 | 0.53 | -12 | 3.2 | ||||||
|
Fort Saskatchewan
|
610 | -32 | -35 | 28 | 19 | 34 | 23 | 5420 | 4450 | 0.5 | 1.6 | 0.1 | 2.3 | 0.1 | 0.66 | -10 | 2 | |||||||
|
Fort Vermilion
|
270 | -41 | -43 | 28 | 18 | 32 | 22 | 6700 | 5660 | 0.5 | 2.1 | 0.1 | 3 | 0.1 | 0.45 | -14 | 3.1 | |||||||
|
Grande Prairie
|
650 | -36 | -39 | 27 | 18 | 32 | 22 | 5790 | 4800 | 0.5 | 120 | 2.2 | 0.1 | 3.2 | 0.2 | 0.7 | -11 | 2.9 | ||||||
|
Habay
|
335 | -41 | -43 | 28 | 18 | 32 | 22 | 6750 | 5710 | 0.5 | 2.4 | 0.1 | 3.4 | 0.1 | 0.45 | -14 | 2 | |||||||
|
Hardisty
|
615 | -33 | -36 | 30 | 19 | 36 | 23 | 5640 | 4660 | 0.5 | 1.7 | 0.1 | 2.5 | 0.2 | 0.54 | -10 | 4 | |||||||
|
High River
|
1040 | -31 | -32 | 28 | 17 | 33 | 21 | 4900 | 3960 | 0.4 | 1.3 | 0.1 | 1.9 | 0.1 | 0.99 | -9 | 2.8 | |||||||
|
Hinton
|
990 | -34 | -38 | 27 | 17 | 33 | 21 | 5500 | 4520 | 0.6 | 2.6 | 0.1 | 3.7 | 0.1 | 0.69 | -9 | 2 | |||||||
|
Jasper
|
1060 | -31 | -34 | 28 | 17 | 34 | 22 | 5300 | 4330 | 0.5 | 3 | 0.1 | 4.3 | 0.1 | 0.47 | -9 | 1.7 | |||||||
|
Keg River
|
420 | -40 | -42 | 28 | 18 | 32 | 22 | 6520 | 5490 | 0.5 | 2.4 | 0.1 | 3.5 | 0.1 | 0.45 | -13 | 3 | |||||||
|
Lac La Biche
|
560 | -35 | -38 | 28 | 19 | 33 | 23 | 6100 | 5090 | 0.6 | 80 | 1.6 | 0.1 | 2.3 | 0.1 | 0.59 | -11 | 2.4 | ||||||
|
Lacombe
|
855 | -33 | -36 | 28 | 19 | 34 | 23 | 5500 | 4520 | 0.5 | 1.9 | 0.1 | 2.8 | 0.1 | 0.61 | -10 | 2.3 | |||||||
|
Lethbridge
|
910 | -30 | -32 | 31 | 19 | 36 | 23 | 4500 | 3580 | 0.3 | 1.2 | 0.1 | 1.8 | 0.2 | 0.96 | -9 | 4 | |||||||
|
Manning
|
465 | -39 | -41 | 27 | 18 | 32 | 22 | 6300 | 5280 | 0.5 | 2.3 | 0.1 | 3.3 | 0.2 | 0.45 | -13 | 2.8 | |||||||
|
Medicine Hat
|
705 | -31 | -34 | 32 | 19 | 37 | 23 | 4540 | 3610 | 0.3 | 1.1 | 0.1 | 1.6 | 0.2 | 0.71 | -9 | 3.6 | |||||||
|
Peace River
|
330 | -37 | -40 | 27 | 18 | 32 | 22 | 6050 | 5040 | 0.5 | 2.2 | 0.1 | 3.2 | 0.2 | 0.5 | -11 | 3.5 | |||||||
|
Pincher Creek
|
1130 | -29 | -32 | 29 | 18 | 34 | 22 | 4740 | 3800 | 0.4 | 1.5 | 0.1 | 2.2 | 0.2 | 1.39 | -9 | 4.6 | |||||||
|
Ranfurly
|
670 | -34 | -37 | 29 | 19 | 34 | 23 | 5700 | 4710 | 0.5 | 100 | 1.9 | 0.1 | 2.7 | 0.1 | 0.54 | -10 | 3.6 | ||||||
|
Red Deer
|
855 | -32 | -35 | 28 | 19 | 34 | 23 | 5550 | 4570 | 0.5 | 1.8 | 0.1 | 2.6 | 0.1 | 0.61 | -10 | 2.8 | |||||||
|
Rocky Mountain House
|
985 | -32 | -34 | 27 | 18 | 33 | 22 | 5640 | 4660 | 0.6 | 1.9 | 0.1 | 2.7 | 0.1 | 0.54 | -10 | 1.9 | |||||||
|
Slave Lake
|
590 | -35 | -38 | 26 | 19 | 31 | 23 | 5850 | 4850 | 0.6 | 80 | 1.9 | 0.1 | 2.8 | 0.2 | 0.6 | -11 | 3.5 | ||||||
|
Stettler
|
820 | -32 | -34 | 30 | 19 | 36 | 23 | 5300 | 4330 | 0.5 | 1.9 | 0.1 | 2.7 | 0.1 | 0.54 | -10 | 4.2 | |||||||
|
Stony Plain
|
710 | -32 | -35 | 28 | 19 | 33 | 23 | 5300 | 4330 | 0.5 | 1.7 | 0.1 | 2.5 | 0.2 | 0.68 | -10 | 2.9 | |||||||
|
Suffield
|
755 | -31 | -34 | 32 | 20 | 37 | 24 | 4770 | 3830 | 0.2 | 1.3 | 0.1 | 1.9 | 0.2 | 0.75 | -10 | 4.5 | |||||||
|
Taber
|
815 | -31 | -33 | 31 | 19 | 36 | 23 | 4580 | 3650 | 0.3 | 1.2 | 0.1 | 1.8 | 0.2 | 0.93 | -9 | 3.8 | |||||||
|
Turner Valley
|
1215 | -31 | -32 | 28 | 17 | 33 | 21 | 5220 | 4260 | 0.5 | 1.4 | 0.1 | 2 | 0.2 | 0.99 | -9 | 3.2 | |||||||
|
Valleyview
|
700 | -37 | -40 | 27 | 18 | 32 | 22 | 5600 | 4620 | 0.5 | 80 | 2.3 | 0.1 | 3.4 | 0.2 | 0.64 | -10 | 3.7 | ||||||
|
Vegreville
|
635 | -34 | -37 | 29 | 19 | 34 | 23 | 5780 | 4790 | 0.5 | 100 | 1.9 | 0.1 | 2.8 | 0.1 | 0.54 | -11 | 3.8 | ||||||
|
Vermilion
|
580 | -35 | -38 | 29 | 19 | 35 | 23 | 5740 | 4750 | 0.5 | 100 | 1.7 | 0.1 | 2.5 | 0.2 | 0.54 | -11 | 3.2 | ||||||
|
Wagner
|
585 | -35 | -38 | 26 | 19 | 31 | 23 | 5850 | 4850 | 0.6 | 80 | 1.9 | 0.1 | 2.8 | 0.2 | 0.6 | -11 | 3.5 | ||||||
|
Wainwright
|
675 | -33 | -36 | 29 | 19 | 35 | 23 | 5700 | 4710 | 0.5 | 2 | 0.1 | 2.9 | 0.2 | 0.54 | -11 | 3.7 | |||||||
|
Wetaskiwin
|
760 | -33 | -35 | 29 | 19 | 34 | 23 | 5500 | 4520 | 0.6 | 2 | 0.1 | 2.9 | 0.1 | 0.6 | -10 | 3.4 | |||||||
|
Whitecourt
|
690 | -33 | -36 | 27 | 19 | 32 | 23 | 5650 | 4670 | 0.6 | 80 | 1.9 | 0.1 | 2.8 | 0.1 | 0.6 | -9 | 3.1 | ||||||
|
Wimborne
|
975 | -31 | -34 | 29 | 18 | 35 | 22 | 5310 | 4340 | 0.5 | 1.6 | 0.1 | 2.3 | 0.1 | 0.61 | -9 | 3.7 | |||||||
| Saskatchewan | ||||||||||||||||||||||||
|
Assiniboia
|
740 | -32 | -34 | 31 | 21 | 36 | 25 | 5180 | 4300 | 0.3 | 1.6 | 0.1 | 2.4 | 0.2 | 0.75 | -10 | 4.7 | |||||||
|
Battrum
|
700 | -32 | -34 | 32 | 20 | 37 | 24 | 5080 | 4210 | 0.4 | 1.2 | 0.1 | 1.8 | 0.2 | 0.82 | -10 | 4.5 | |||||||
|
Biggar
|
645 | -34 | -36 | 30 | 20 | 35 | 24 | 5720 | 4820 | 0.4 | 2.1 | 0.1 | 3.1 | 0.2 | 0.68 | -11 | 4 | |||||||
|
Broadview
|
600 | -34 | -35 | 30 | 21 | 35 | 25 | 5760 | 4850 | 0.5 | 1.7 | 0.1 | 2.5 | 0.1 | 0.72 | -11 | 3.7 | |||||||
|
Dafoe
|
530 | -35 | -37 | 29 | 21 | 34 | 25 | 5860 | 4950 | 0.5 | 1.7 | 0.1 | 2.5 | 0.1 | 0.58 | -11 | 4 | |||||||
|
Dundurn
|
525 | -35 | -37 | 30 | 21 | 35 | 25 | 5600 | 4700 | 0.4 | 1.5 | 0.1 | 2.2 | 0.2 | 0.72 | -11 | 4.2 | |||||||
|
Estevan
|
565 | -32 | -34 | 32 | 22 | 37 | 25 | 5340 | 4450 | 0.4 | 1.6 | 0.1 | 2.4 | 0.2 | 0.81 | -11 | 4.7 | |||||||
|
Hudson Bay
|
370 | -36 | -38 | 29 | 21 | 34 | 25 | 6280 | 5350 | 0.6 | 80 | 2 | 0.1 | 2.8 | 0.1 | 0.58 | -12 | 2.9 | ||||||
|
Humboldt
|
565 | -36 | -38 | 28 | 21 | 33 | 25 | 6000 | 5080 | 0.5 | 140 | 2.1 | 0.1 | 3 | 0.1 | 0.6 | -12 | 4 | ||||||
|
Island Falls
|
305 | -39 | -41 | 27 | 20 | 32 | 24 | 7100 | 6130 | 0.6 | 80 | 2.1 | 0.1 | 2.9 | 0.1 | 0.58 | -14 | 1.8 | ||||||
|
Kamsack
|
455 | -34 | -37 | 29 | 22 | 34 | 26 | 6040 | 5120 | 0.6 | 120 | 2.1 | 0.2 | 3 | 0.3 | 0.61 | -11 | 4 | ||||||
|
Kindersley
|
685 | -33 | -35 | 31 | 20 | 36 | 24 | 5550 | 4650 | 0.4 | 1.4 | 0.1 | 2.1 | 0.2 | 0.72 | -11 | 4.8 | |||||||
|
Lloydminster
|
645 | -34 | -37 | 28 | 20 | 34 | 24 | 5880 | 4970 | 0.5 | 120 | 2 | 0.1 | 2.9 | 0.2 | 0.61 | -11 | 4.6 | ||||||
|
Maple Creek
|
765 | -31 | -34 | 31 | 20 | 36 | 24 | 4780 | 3920 | 0.3 | 1.2 | 0.1 | 1.8 | 0.2 | 0.68 | -10 | 3.3 | |||||||
|
Meadow Lake
|
480 | -38 | -40 | 28 | 20 | 33 | 24 | 6280 | 5350 | 0.5 | 120 | 1.7 | 0.1 | 2.4 | 0.1 | 0.65 | -12 | 3.6 | ||||||
|
Melfort
|
455 | -36 | -38 | 28 | 21 | 33 | 25 | 6050 | 5130 | 0.5 | 120 | 2.1 | 0.1 | 3 | 0.1 | 0.57 | -12 | 3.9 | ||||||
|
Melville
|
550 | -34 | -36 | 29 | 21 | 34 | 25 | 5880 | 4970 | 0.5 | 160 | 1.7 | 0.1 | 2.4 | 0.1 | 0.61 | -11 | 4.5 | ||||||
|
Moose Jaw
|
545 | -32 | -34 | 31 | 21 | 36 | 25 | 5270 | 4390 | 0.3 | 1.4 | 0.1 | 2.1 | 0.2 | 0.81 | -10 | 4.7 | |||||||
|
Nipawin
|
365 | -37 | -39 | 28 | 21 | 33 | 25 | 6300 | 5370 | 0.6 | 100 | 2 | 0.1 | 2.9 | 0.1 | 0.59 | -12 | 4 | ||||||
|
North Battleford
|
545 | -34 | -36 | 29 | 20 | 34 | 24 | 5900 | 4990 | 0.5 | 1.7 | 0.1 | 2.5 | 0.2 | 0.72 | -11 | 4.1 | |||||||
|
Prince Albert
|
435 | -37 | -40 | 28 | 21 | 33 | 25 | 6100 | 5180 | 0.5 | 140 | 1.9 | 0.1 | 2.7 | 0.1 | 0.59 | -12 | 3.3 | ||||||
|
Qu'Appelle
|
645 | -34 | -36 | 30 | 22 | 35 | 26 | 5620 | 4720 | 0.5 | 1.7 | 0.1 | 2.5 | 0.2 | 0.65 | -11 | 4.8 | |||||||
|
Regina
|
575 | -34 | -36 | 31 | 21 | 36 | 25 | 5600 | 4700 | 0.4 | 1.4 | 0.1 | 2.1 | 0.2 | 0.75 | -11 | 5.2 | |||||||
|
Rosetown
|
595 | -34 | -36 | 31 | 20 | 36 | 24 | 5620 | 4720 | 0.4 | 1.7 | 0.1 | 2.5 | 0.2 | 0.75 | -11 | 3.9 | |||||||
|
Saskatoon
|
500 | -35 | -37 | 30 | 21 | 35 | 25 | 5700 | 4800 | 0.4 | 1.7 | 0.1 | 2.5 | 0.2 | 0.72 | -11 | 4.4 | |||||||
|
Scott
|
645 | -34 | -36 | 30 | 20 | 35 | 24 | 5960 | 5040 | 0.4 | 1.9 | 0.1 | 2.8 | 0.2 | 0.68 | -11 | 3.5 | |||||||
|
Strasbourg
|
545 | -34 | -36 | 30 | 22 | 35 | 26 | 5600 | 4700 | 0.4 | 1.5 | 0.1 | 2.2 | 0.2 | 0.65 | -11 | 4.5 | |||||||
|
Swift Current
|
750 | -31 | -34 | 31 | 20 | 36 | 24 | 5150 | 4270 | 0.3 | 1.4 | 0.1 | 2 | 0.2 | 0.82 | -10 | 6 | |||||||
|
Uranium City
|
265 | -42 | -44 | 26 | 19 | 30 | 22 | 7500 | 6510 | 0.6 | 100 | 2 | 0.1 | 2.7 | 0.1 | 0.56 | -16 | 2.8 | ||||||
|
Weyburn
|
575 | -33 | -35 | 31 | 23 | 36 | 27 | 5400 | 4510 | 0.4 | 1.8 | 0.1 | 2.7 | 0.2 | 0.74 | -11 | 4.7 | |||||||
|
Yorkton
|
510 | -34 | -37 | 29 | 21 | 34 | 25 | 6000 | 5080 | 0.5 | 140 | 1.9 | 0.1 | 2.7 | 0.1 | 0.61 | -11 | 4.6 | ||||||
| Manitoba | ||||||||||||||||||||||||
|
Beausejour
|
245 | -33 | -35 | 29 | 23 | 33 | 26 | 5680 | 4780 | 0.6 | 2 | 0.2 | 2.9 | 0.3 | 0.64 | -12 | 3.3 | |||||||
|
Boissevain
|
510 | -32 | -34 | 30 | 23 | 34 | 26 | 5500 | 4610 | 0.5 | 2.2 | 0.2 | 3.2 | 0.3 | 0.81 | -11 | 4.5 | |||||||
|
Brandon
|
395 | -33 | -35 | 30 | 22 | 35 | 25 | 5760 | 4850 | 0.6 | 2.1 | 0.2 | 3 | 0.3 | 0.75 | -11 | 4.7 | |||||||
|
Churchill
|
10 | -38 | -40 | 25 | 18 | 29 | 22 | 8950 | 7890 | 0.8 | 3 | 0.2 | 4.3 | 0.3 | 0.82 | -16 | 5.9 | |||||||
|
Dauphin
|
295 | -33 | -35 | 30 | 22 | 35 | 26 | 5900 | 4990 | 0.6 | 1.9 | 0.2 | 2.8 | 0.3 | 0.61 | -11 | 4 | |||||||
|
Flin Flon
|
300 | -38 | -40 | 27 | 20 | 32 | 24 | 6440 | 5500 | 0.6 | 80 | 2.2 | 0.2 | 3 | 0.3 | 0.53 | -14 | 3 | ||||||
|
Gimli
|
220 | -34 | -36 | 29 | 23 | 33 | 26 | 5800 | 4890 | 0.7 | 1.9 | 0.2 | 2.7 | 0.3 | 0.61 | -12 | 4.1 | |||||||
|
Island Lake
|
240 | -36 | -38 | 27 | 20 | 31 | 23 | 6900 | 5940 | 0.7 | 80 | 2.6 | 0.2 | 3.6 | 0.3 | 0.58 | -14 | 3.3 | ||||||
|
Lac du Bonnet
|
260 | -34 | -36 | 29 | 23 | 33 | 26 | 5730 | 4830 | 0.7 | 1.9 | 0.2 | 2.7 | 0.3 | 0.58 | -12 | 2.8 | |||||||
|
Lynn Lake
|
350 | -40 | -42 | 27 | 19 | 31 | 23 | 7770 | 6770 | 0.6 | 100 | 2.4 | 0.2 | 3.4 | 0.3 | 0.55 | -15 | 2 | ||||||
|
Morden
|
300 | -31 | -33 | 30 | 24 | 34 | 27 | 5400 | 4510 | 0.6 | 2.2 | 0.2 | 3.3 | 0.3 | 0.81 | -10 | 3.7 | |||||||
|
Neepawa
|
365 | -32 | -34 | 29 | 23 | 34 | 26 | 5760 | 4850 | 0.6 | 2.2 | 0.2 | 3.3 | 0.3 | 0.67 | -11 | 4 | |||||||
|
Pine Falls
|
220 | -34 | -36 | 28 | 23 | 32 | 26 | 5900 | 4990 | 0.7 | 1.9 | 0.2 | 2.7 | 0.3 | 0.6 | -12 | 4 | |||||||
|
Portage la Prairie
|
260 | -31 | -33 | 30 | 23 | 34 | 26 | 5600 | 4700 | 0.5 | 2.1 | 0.2 | 3.1 | 0.3 | 0.72 | -11 | 4 | |||||||
|
Rivers
|
465 | -34 | -36 | 29 | 23 | 33 | 26 | 5840 | 4930 | 0.6 | 2.1 | 0.2 | 3 | 0.3 | 0.72 | -12 | 4.4 | |||||||
|
Sandilands
|
365 | -32 | -34 | 29 | 23 | 33 | 26 | 5650 | 4750 | 0.6 | 2.2 | 0.2 | 3.2 | 0.3 | 0.61 | -11 | 4 | |||||||
|
Selkirk
|
225 | -33 | -35 | 29 | 23 | 33 | 26 | 5700 | 4800 | 0.6 | 1.9 | 0.2 | 2.8 | 0.3 | 0.64 | -11 | 4.5 | |||||||
|
Split Lake
|
175 | -38 | -40 | 27 | 19 | 31 | 23 | 7900 | 6890 | 0.7 | 120 | 2.5 | 0.2 | 3.5 | 0.3 | 0.57 | -15 | 3.4 | ||||||
|
Steinbach
|
270 | -33 | -35 | 29 | 23 | 33 | 26 | 5700 | 4800 | 0.6 | 2 | 0.2 | 3 | 0.3 | 0.61 | -11 | 4.1 | |||||||
|
Swan River
|
335 | -34 | -37 | 29 | 22 | 34 | 26 | 6100 | 5180 | 0.6 | 120 | 2 | 0.2 | 2.8 | 0.3 | 0.53 | -12 | 3.5 | ||||||
|
The Pas
|
270 | -36 | -38 | 28 | 21 | 33 | 25 | 6480 | 5540 | 0.6 | 160 | 2.2 | 0.2 | 3.1 | 0.3 | 0.58 | -13 | 3.4 | ||||||
|
Thompson
|
205 | -40 | -43 | 27 | 19 | 31 | 23 | 7600 | 6600 | 0.6 | 100 | 2.4 | 0.2 | 3.3 | 0.3 | 0.54 | -15 | 2.9 | ||||||
|
Virden
|
435 | -33 | -35 | 30 | 23 | 34 | 26 | 5620 | 4720 | 0.5 | 2 | 0.2 | 2.8 | 0.3 | 0.72 | -11 | 4 | |||||||
|
Winnipeg
|
235 | -33 | -35 | 30 | 23 | 34 | 26 | 5670 | 4770 | 0.6 | 1.9 | 0.2 | 2.8 | 0.3 | 0.68 | -11 | 5.2 | |||||||
| Ontario | ||||||||||||||||||||||||
|
Ailsa Craig
|
230 | -17 | -19 | 30 | 23 | 34 | 26 | 3840 | 3050 | 0.9 | 2.2 | 0.4 | 3.2 | 0.6 | 0.8 | -6 | 4.5 | |||||||
|
Ajax
|
95 | -20 | -22 | 30 | 23 | 34 | 26 | 3820 | 3030 | 0.9 | 1 | 0.4 | 1.5 | 0.6 | 0.8 | -6 | 4 | |||||||
|
Alexandria
|
80 | -24 | -26 | 30 | 23 | 34 | 26 | 4600 | 3740 | 160 | 2.4 | 0.4 | 3.4 | 0.6 | 0.67 | -8 | 3.8 | |||||||
|
Alliston
|
220 | -23 | -25 | 29 | 23 | 33 | 26 | 4200 | 3380 | 0.8 | 2 | 0.4 | 2.9 | 0.6 | 0.59 | -7 | 3.5 | |||||||
|
Almonte
|
120 | -26 | -28 | 30 | 23 | 34 | 26 | 4620 | 3760 | 140 | 2.5 | 0.4 | 3.6 | 0.6 | 0.67 | -8 | 3.8 | |||||||
|
Armstrong
|
340 | -37 | -40 | 28 | 21 | 32 | 24 | 6500 | 5530 | 0.8 | 2.7 | 0.4 | 3.8 | 0.6 | 0.52 | -12 | 2.3 | |||||||
|
Arnprior
|
85 | -27 | -29 | 30 | 23 | 34 | 26 | 4680 | 3820 | 140 | 2.5 | 0.4 | 3.6 | 0.6 | 0.61 | -8 | 3.5 | |||||||
|
Atikokan
|
400 | -33 | -35 | 29 | 22 | 33 | 25 | 5750 | 4810 | 0.8 | 2.4 | 0.3 | 3.4 | 0.4 | 0.52 | -11 | 1.7 | |||||||
|
Attawapiskat
|
10 | -37 | -39 | 28 | 21 | 32 | 24 | 7100 | 6120 | 0.8 | 2.8 | 0.3 | 3.9 | 0.4 | 0.68 | -13 | 4 | |||||||
|
Aurora
|
270 | -21 | -23 | 30 | 23 | 34 | 26 | 4210 | 3390 | 0.8 | 2 | 0.4 | 2.9 | 0.6 | 0.73 | -7 | 3.5 | |||||||
|
Bancroft
|
365 | -28 | -31 | 29 | 23 | 33 | 26 | 4740 | 3870 | 0.9 | 3.1 | 0.4 | 4.3 | 0.6 | 0.52 | -8 | 1.6 | |||||||
|
Barrie
|
245 | -24 | -26 | 29 | 23 | 33 | 26 | 4380 | 3540 | 0.8 | 2.5 | 0.4 | 3.6 | 0.6 | 0.59 | -7 | 3.6 | |||||||
|
Barriefield
|
100 | -22 | -24 | 28 | 23 | 32 | 26 | 3990 | 3190 | 1 | 2.1 | 0.4 | 3 | 0.6 | 0.76 | -7 | 4.3 | |||||||
|
Beaverton
|
240 | -24 | -26 | 30 | 23 | 34 | 26 | 4300 | 3470 | 0.9 | 2.2 | 0.4 | 3.2 | 0.6 | 0.59 | -7 | 4.8 | |||||||
|
Belleville
|
90 | -22 | -24 | 29 | 23 | 33 | 26 | 3910 | 3110 | 0.9 | 1.7 | 0.4 | 2.4 | 0.6 | 0.69 | -7 | 4 | |||||||
|
Belmont
|
260 | -17 | -19 | 30 | 24 | 34 | 27 | 3840 | 3050 | 1 | 1.7 | 0.4 | 2.5 | 0.6 | 0.76 | -6 | 3.5 | |||||||
|
Borden (CFB)
|
225 | -23 | -25 | 29 | 23 | 33 | 26 | 4300 | 3470 | 2.2 | 0.4 | 3.2 | 0.6 | 0.59 | -6 | 3.6 | ||||||||
|
Bracebridge
|
310 | -26 | -28 | 29 | 23 | 33 | 26 | 4800 | 3920 | 1 | 3.1 | 0.4 | 4.3 | 0.6 | 0.58 | -8 | 2 | |||||||
|
Bradford
|
240 | -23 | -25 | 30 | 23 | 34 | 26 | 4280 | 3450 | 0.8 | 2.1 | 0.4 | 3 | 0.6 | 0.59 | -7 | 3.5 | |||||||
|
Brampton
|
215 | -19 | -21 | 30 | 23 | 34 | 26 | 4100 | 3290 | 0.8 | 1.3 | 0.4 | 1.9 | 0.6 | 0.73 | -6 | 5 | |||||||
|
Brantford
|
205 | -18 | -20 | 30 | 23 | 34 | 26 | 3900 | 3110 | 0.9 | 1.3 | 0.4 | 1.9 | 0.6 | 0.68 | -6 | 4.4 | |||||||
|
Brighton
|
95 | -21 | -23 | 29 | 23 | 33 | 26 | 4000 | 3200 | 0.9 | 1.6 | 0.4 | 2.3 | 0.6 | 0.8 | -6 | 3.8 | |||||||
|
Brockville
|
85 | -23 | -25 | 29 | 23 | 33 | 26 | 4060 | 3250 | 0.9 | 180 | 2.2 | 0.4 | 3.1 | 0.6 | 0.73 | -8 | 3.2 | ||||||
|
Burk's Falls
|
305 | -26 | -28 | 29 | 22 | 33 | 25 | 5020 | 4120 | 0.9 | 120 | 2.7 | 0.4 | 3.7 | 0.6 | 0.58 | -9 | 2.5 | ||||||
|
Burlington
|
80 | -17 | -19 | 31 | 23 | 35 | 26 | 3740 | 2960 | 0.9 | 1.1 | 0.4 | 1.6 | 0.6 | 0.75 | -5 | 4 | |||||||
|
Cambridge
|
295 | -18 | -20 | 29 | 23 | 33 | 26 | 4100 | 3290 | 0.9 | 1.6 | 0.4 | 2.3 | 0.6 | 0.59 | -6 | 4.4 | |||||||
|
Campbellford
|
150 | -23 | -26 | 30 | 23 | 34 | 26 | 4280 | 3450 | 0.9 | 1.7 | 0.4 | 2.4 | 0.6 | 0.67 | -7 | 2.2 | |||||||
|
Cannington
|
255 | -24 | -26 | 30 | 23 | 34 | 26 | 4310 | 3480 | 0.9 | 2.2 | 0.4 | 3.2 | 0.6 | 0.59 | -7 | 3.5 | |||||||
|
Carleton Place
|
135 | -25 | -27 | 30 | 23 | 34 | 26 | 4600 | 3740 | 160 | 2.5 | 0.4 | 3.6 | 0.6 | 0.67 | -8 | 2.8 | |||||||
|
Cavan
|
200 | -23 | -25 | 30 | 23 | 34 | 26 | 4400 | 3560 | 0.9 | 2 | 0.4 | 2.9 | 0.6 | 0.73 | -7 | 3.3 | |||||||
|
Centralia
|
260 | -17 | -19 | 30 | 23 | 34 | 26 | 3800 | 3010 | 1 | 2.3 | 0.4 | 3.3 | 0.6 | 0.8 | -6 | 4.5 | |||||||
|
Chapleau
|
425 | -35 | -38 | 27 | 21 | 31 | 24 | 5900 | 4950 | 0.7 | 80 | 3.6 | 0.4 | 5.1 | 0.6 | 0.5 | -10 | 3.5 | ||||||
|
Chatham
|
180 | -16 | -18 | 31 | 24 | 34 | 27 | 3470 | 2710 | 0.9 | 1 | 0.4 | 1.5 | 0.6 | 0.69 | -5 | 5 | |||||||
|
Chesley
|
275 | -19 | -21 | 29 | 22 | 33 | 25 | 4320 | 3490 | 0.9 | 2.8 | 0.4 | 4 | 0.6 | 0.74 | -6 | 4 | |||||||
|
Clinton
|
280 | -17 | -19 | 29 | 23 | 33 | 26 | 4150 | 3330 | 0.9 | 2.6 | 0.4 | 3.8 | 0.6 | 0.75 | -6 | 5 | |||||||
|
Coboconk
|
270 | -25 | -27 | 30 | 23 | 34 | 26 | 4500 | 3650 | 0.9 | 2.5 | 0.4 | 3.5 | 0.6 | 0.58 | -7 | 2 | |||||||
|
Cobourg
|
90 | -21 | -23 | 29 | 23 | 33 | 26 | 3980 | 3180 | 0.9 | 1.2 | 0.4 | 1.7 | 0.6 | 0.81 | -6 | 3.6 | |||||||
|
Cochrane
|
245 | -34 | -36 | 29 | 21 | 33 | 24 | 6200 | 5240 | 0.8 | 80 | 2.8 | 0.3 | 3.9 | 0.4 | 0.55 | -12 | 3.8 | ||||||
|
Colborne
|
105 | -21 | -23 | 29 | 23 | 33 | 26 | 3980 | 3180 | 0.9 | 1.6 | 0.4 | 2.3 | 0.6 | 0.81 | -6 | 3.6 | |||||||
|
Collingwood
|
190 | -21 | -23 | 29 | 23 | 33 | 26 | 4180 | 3360 | 0.9 | 2.7 | 0.4 | 3.9 | 0.6 | 0.65 | -6 | 3.7 | |||||||
|
Cornwall
|
35 | -23 | -25 | 30 | 23 | 34 | 26 | 4250 | 3420 | 180 | 2.2 | 0.4 | 3 | 0.6 | 0.67 | -8 | 3.1 | |||||||
|
Corunna
|
185 | -16 | -18 | 31 | 24 | 34 | 27 | 3600 | 2830 | 0.9 | 1 | 0.4 | 1.5 | 0.6 | 0.76 | -5 | 4.7 | |||||||
|
Deep River
|
145 | -29 | -32 | 30 | 22 | 34 | 25 | 4900 | 3980 | 0.8 | 2.5 | 0.4 | 3.5 | 0.6 | 0.58 | -9 | 3.2 | |||||||
|
Deseronto
|
85 | -22 | -24 | 29 | 23 | 33 | 26 | 4070 | 3260 | 0.9 | 1.9 | 0.4 | 2.8 | 0.6 | 0.69 | -7 | 4 | |||||||
|
Dorchester
|
260 | -18 | -20 | 30 | 24 | 34 | 27 | 3900 | 3110 | 1 | 1.9 | 0.4 | 2.7 | 0.6 | 0.76 | -6 | 4.4 | |||||||
|
Dorion
|
200 | -33 | -35 | 28 | 21 | 32 | 24 | 5950 | 5000 | 0.8 | 2.8 | 0.4 | 4 | 0.6 | 0.67 | -10 | 3.3 | |||||||
|
Dresden
|
185 | -16 | -18 | 31 | 24 | 34 | 27 | 3750 | 2970 | 0.8 | 1 | 0.4 | 1.5 | 0.6 | 0.69 | -6 | 4.2 | |||||||
|
Dryden
|
370 | -34 | -36 | 28 | 22 | 32 | 25 | 5850 | 4940 | 0.7 | 2.4 | 0.3 | 3.4 | 0.4 | 0.52 | -11 | 3.9 | |||||||
|
Dundalk
|
525 | -22 | -24 | 29 | 22 | 33 | 25 | 4700 | 3830 | 0.9 | 3.2 | 0.4 | 4.6 | 0.6 | 0.68 | -7 | 3.8 | |||||||
|
Dunnville
|
175 | -15 | -17 | 30 | 24 | 34 | 27 | 3660 | 2890 | 1 | 2 | 0.4 | 3 | 0.6 | 0.75 | -5 | 3.8 | |||||||
|
Durham
|
340 | -20 | -22 | 29 | 22 | 33 | 25 | 4340 | 3510 | 0.9 | 2.8 | 0.4 | 4 | 0.6 | 0.73 | -7 | 3.8 | |||||||
|
Dutton
|
225 | -16 | -18 | 31 | 24 | 35 | 27 | 3700 | 2920 | 1 | 1.3 | 0.4 | 1.9 | 0.6 | 0.76 | -6 | 4 | |||||||
|
Earlton
|
245 | -33 | -36 | 29 | 22 | 33 | 25 | 5730 | 4790 | 0.8 | 3.1 | 0.4 | 4.3 | 0.6 | 0.74 | -11 | 4.2 | |||||||
|
Edison
|
365 | -34 | -36 | 28 | 22 | 32 | 25 | 5740 | 4840 | 0.7 | 2.4 | 0.3 | 3.4 | 0.4 | 0.53 | -11 | 3.9 | |||||||
|
Elliot Lake
|
380 | -26 | -28 | 29 | 21 | 33 | 24 | 4950 | 4030 | 0.8 | 2.9 | 0.4 | 4.1 | 0.6 | 0.62 | -8 | 4 | |||||||
|
Elmvale
|
220 | -24 | -26 | 29 | 23 | 33 | 26 | 4200 | 3380 | 0.9 | 2.6 | 0.4 | 3.7 | 0.6 | 0.59 | -6 | 3.7 | |||||||
|
Embro
|
310 | -19 | -21 | 30 | 23 | 34 | 26 | 3950 | 3150 | 0.9 | 2 | 0.4 | 2.9 | 0.6 | 0.8 | -6 | 4.4 | |||||||
|
Englehart
|
205 | -33 | -36 | 29 | 22 | 33 | 25 | 5800 | 4860 | 0.8 | 2.8 | 0.4 | 3.9 | 0.6 | 0.67 | -11 | 4.2 | |||||||
|
Espanola
|
220 | -25 | -27 | 29 | 21 | 33 | 24 | 4920 | 4000 | 0.8 | 2.3 | 0.4 | 3.3 | 0.6 | 0.68 | -8 | 4 | |||||||
|
Exeter
|
265 | -17 | -19 | 30 | 23 | 34 | 26 | 3900 | 3110 | 0.9 | 2.4 | 0.4 | 3.4 | 0.6 | 0.8 | -6 | 5 | |||||||
|
Fenelon Falls
|
260 | -25 | -27 | 30 | 23 | 34 | 26 | 4440 | 3600 | 0.9 | 2.3 | 0.4 | 3.3 | 0.6 | 0.59 | -7 | 2 | |||||||
|
Fergus
|
400 | -20 | -22 | 29 | 23 | 33 | 26 | 4300 | 3470 | 0.9 | 2.2 | 0.4 | 3.2 | 0.6 | 0.59 | -6 | 4.3 | |||||||
|
Forest
|
215 | -16 | -18 | 31 | 23 | 35 | 26 | 3740 | 2960 | 2 | 0.4 | 2.9 | 0.6 | 0.8 | -6 | 4.7 | ||||||||
|
Fort Erie
|
180 | -15 | -17 | 30 | 24 | 34 | 27 | 3650 | 2880 | 1 | 2.3 | 0.4 | 3.4 | 0.6 | 0.75 | -5 | 5 | |||||||
|
Fort Erie (Ridgeway)
|
190 | -15 | -17 | 30 | 24 | 34 | 27 | 3600 | 2830 | 1 | 2.3 | 0.4 | 3.4 | 0.6 | 0.75 | -5 | 5 | |||||||
|
Fort Frances
|
340 | -33 | -35 | 29 | 22 | 33 | 25 | 5440 | 4550 | 0.7 | 2.3 | 0.3 | 3.3 | 0.4 | 0.53 | -11 | 3.2 | |||||||
|
Gananoque
|
80 | -22 | -24 | 28 | 23 | 32 | 26 | 4010 | 3210 | 0.9 | 180 | 2.1 | 0.4 | 3 | 0.6 | 0.76 | -7 | 3.8 | ||||||
|
Geraldton
|
345 | -36 | -39 | 28 | 21 | 32 | 24 | 6450 | 5490 | 0.8 | 2.9 | 0.4 | 4 | 0.6 | 0.52 | -11 | 2.5 | |||||||
|
Glencoe
|
215 | -16 | -18 | 31 | 24 | 35 | 27 | 3680 | 2900 | 0.9 | 1.5 | 0.4 | 2.2 | 0.6 | 0.69 | -6 | 4.2 | |||||||
|
Goderich
|
185 | -16 | -18 | 29 | 23 | 33 | 26 | 4000 | 3200 | 1 | 2.4 | 0.4 | 3.5 | 0.6 | 0.8 | -6 | 5.3 | |||||||
|
Gore Bay
|
205 | -24 | -26 | 28 | 22 | 32 | 25 | 4700 | 3830 | 0.8 | 2.6 | 0.4 | 3.7 | 0.6 | 0.73 | -8 | 4.3 | |||||||
|
Graham
|
495 | -35 | -37 | 29 | 22 | 33 | 25 | 5940 | 4990 | 0.8 | 2.6 | 0.3 | 3.7 | 0.4 | 0.52 | -11 | 2.5 | |||||||
|
Gravenhurst (Muskoka Airport)
|
255 | -26 | -28 | 29 | 23 | 33 | 26 | 4760 | 3890 | 0.9 | 2.7 | 0.4 | 3.8 | 0.6 | 0.59 | -8 | 2 | |||||||
|
Grimsby
|
85 | -16 | -18 | 30 | 23 | 34 | 26 | 3520 | 2760 | 0.9 | 0.9 | 0.4 | 1.3 | 0.6 | 0.75 | -5 | 4.5 | |||||||
|
Guelph
|
340 | -19 | -21 | 29 | 23 | 33 | 26 | 4270 | 3440 | 0.9 | 1.9 | 0.4 | 2.7 | 0.6 | 0.59 | -6 | 4.5 | |||||||
|
Guthrie
|
280 | -24 | -26 | 29 | 23 | 33 | 26 | 4300 | 3470 | 0.8 | 2.5 | 0.4 | 3.6 | 0.6 | 0.59 | -7 | 3.5 | |||||||
|
Haileybury
|
210 | -32 | -35 | 30 | 22 | 34 | 25 | 5600 | 4660 | 0.8 | 2.4 | 0.4 | 3.3 | 0.6 | 0.73 | -11 | 3.9 | |||||||
|
Haldimand (Caledonia)
|
190 | -18 | -20 | 30 | 23 | 34 | 26 | 3750 | 2970 | 0.9 | 1.2 | 0.4 | 1.8 | 0.6 | 0.73 | -6 | 4.5 | |||||||
|
Haldimand (Hagersville)
|
215 | -17 | -19 | 30 | 23 | 34 | 26 | 3760 | 2980 | 1 | 1.3 | 0.4 | 1.9 | 0.6 | 0.75 | -6 | 4.5 | |||||||
|
Haliburton
|
335 | -27 | -29 | 29 | 23 | 33 | 26 | 4840 | 3960 | 0.9 | 2.9 | 0.4 | 4 | 0.6 | 0.58 | -8 | 2 | |||||||
|
Halton Hills (Georgetown)
|
255 | -19 | -21 | 30 | 23 | 34 | 26 | 4200 | 3380 | 0.8 | 1.4 | 0.4 | 2 | 0.6 | 0.61 | -6 | 4.8 | |||||||
|
Hamilton
|
90 | -17 | -19 | 31 | 23 | 35 | 26 | 3460 | 2700 | 0.9 | 1.1 | 0.4 | 1.6 | 0.6 | 0.75 | -6 | 3.5 | |||||||
|
Hanover
|
270 | -19 | -21 | 29 | 22 | 33 | 25 | 4300 | 3470 | 0.9 | 2.6 | 0.4 | 3.8 | 0.6 | 0.73 | -7 | 3.8 | |||||||
|
Hastings
|
200 | -24 | -26 | 30 | 23 | 34 | 26 | 4280 | 3450 | 0.9 | 2 | 0.4 | 2.8 | 0.6 | 0.67 | -7 | 3 | |||||||
|
Hawkesbury
|
50 | -25 | -27 | 30 | 23 | 34 | 26 | 4610 | 3750 | 160 | 2.3 | 0.4 | 3.2 | 0.6 | 0.67 | -8 | 3.8 | |||||||
|
Hearst
|
245 | -35 | -37 | 29 | 21 | 33 | 24 | 6450 | 5490 | 0.7 | 80 | 2.8 | 0.3 | 3.9 | 0.4 | 0.47 | -12 | 3.5 | ||||||
|
Honey Harbour
|
180 | -24 | -26 | 29 | 23 | 33 | 26 | 4300 | 3470 | 0.9 | 2.7 | 0.4 | 3.8 | 0.6 | 0.65 | -7 | 4 | |||||||
|
Hornepayne
|
360 | -37 | -40 | 28 | 21 | 32 | 24 | 6340 | 5380 | 0.7 | 80 | 3.3 | 0.4 | 4.5 | 0.6 | 0.52 | -11 | 3 | ||||||
|
Huntsville
|
335 | -26 | -29 | 29 | 22 | 33 | 25 | 4850 | 3970 | 0.9 | 120 | 2.9 | 0.4 | 4 | 0.6 | 0.58 | -8 | 2 | ||||||
|
Ingersoll
|
280 | -18 | -20 | 30 | 23 | 34 | 26 | 3920 | 3120 | 1 | 1.7 | 0.4 | 2.4 | 0.6 | 0.8 | -6 | 4.4 | |||||||
|
Iroquois Falls
|
275 | -33 | -36 | 29 | 21 | 33 | 24 | 6100 | 5150 | 0.8 | 100 | 2.9 | 0.3 | 4 | 0.4 | 0.58 | -11 | 3.5 | ||||||
|
Jellicoe
|
330 | -36 | -39 | 28 | 21 | 32 | 24 | 6400 | 5440 | 0.8 | 2.7 | 0.4 | 3.8 | 0.6 | 0.52 | -11 | 2.3 | |||||||
|
Kapuskasing
|
245 | -34 | -36 | 29 | 21 | 33 | 24 | 6250 | 5290 | 0.8 | 100 | 3 | 0.3 | 4.2 | 0.4 | 0.49 | -12 | 3.9 | ||||||
|
Kemptville
|
90 | -25 | -27 | 30 | 23 | 34 | 26 | 4540 | 3690 | 160 | 2.3 | 0.4 | 3.3 | 0.6 | 0.67 | -8 | 2.3 | |||||||
|
Kenora
|
370 | -33 | -35 | 28 | 22 | 32 | 25 | 5630 | 4730 | 0.6 | 120 | 2.5 | 0.3 | 3.6 | 0.4 | 0.53 | -11 | 2.9 | ||||||
|
Killaloe
|
185 | -28 | -31 | 30 | 22 | 34 | 25 | 4960 | 4070 | 0.8 | 120 | 2.7 | 0.4 | 3.9 | 0.6 | 0.58 | -9 | 2 | ||||||
|
Kincardine
|
190 | -17 | -19 | 28 | 22 | 32 | 25 | 3890 | 3100 | 1 | 2.6 | 0.4 | 3.8 | 0.6 | 0.8 | -6 | 5.3 | |||||||
|
Kingston
|
80 | -22 | -24 | 28 | 23 | 32 | 26 | 4000 | 3200 | 1 | 2.1 | 0.4 | 3 | 0.6 | 0.76 | -7 | 4.3 | |||||||
|
Kinmount
|
295 | -26 | -28 | 29 | 23 | 33 | 26 | 4600 | 3740 | 0.9 | 2.7 | 0.4 | 3.8 | 0.6 | 0.58 | -7 | 2 | |||||||
|
Kirkland Lake
|
325 | -33 | -36 | 29 | 22 | 33 | 25 | 6000 | 5050 | 0.8 | 100 | 2.9 | 0.3 | 4 | 0.4 | 0.62 | -11 | 3.8 | ||||||
|
Kitchener
|
335 | -19 | -21 | 29 | 23 | 33 | 26 | 4200 | 3380 | 0.9 | 2 | 0.4 | 2.9 | 0.6 | 0.61 | -6 | 4.5 | |||||||
|
Kitchenuhmaykoosib / Big Trout Lake
|
215 | -38 | -40 | 26 | 20 | 30 | 23 | 7450 | – | 0.8 | 150 | 3.2 | 0.2 | 4.6 | 0.3 | 0.69 | -14 | 3.7 | ||||||
|
Lakefield
|
240 | -24 | -26 | 30 | 23 | 34 | 26 | 4330 | 3500 | 0.9 | 2.2 | 0.4 | 3.1 | 0.6 | 0.62 | -7 | 2 | |||||||
|
Lansdowne House
|
240 | -38 | -40 | 28 | 21 | 32 | 24 | 7150 | 6160 | 0.8 | 3 | 0.2 | 4.2 | 0.3 | 0.52 | -13 | 3.5 | |||||||
|
Leamington
|
190 | -15 | -17 | 31 | 24 | 34 | 27 | 3400 | 2650 | 0.9 | 0.8 | 0.4 | 1.2 | 0.6 | 0.76 | -5 | 5 | |||||||
|
Lindsay
|
265 | -24 | -26 | 30 | 23 | 34 | 26 | 4320 | 3490 | 0.8 | 2.3 | 0.4 | 3.3 | 0.6 | 0.62 | -7 | 2.5 | |||||||
|
Lion's Head
|
185 | -19 | -21 | 27 | 22 | 31 | 25 | 4300 | 3470 | 0.9 | 2.7 | 0.4 | 3.9 | 0.6 | 0.8 | -6 | 4.1 | |||||||
|
Listowel
|
380 | -19 | -21 | 29 | 23 | 33 | 26 | 4300 | 3470 | 0.9 | 2.6 | 0.4 | 3.8 | 0.6 | 0.69 | -6 | 4.5 | |||||||
|
London
|
245 | -18 | -20 | 30 | 24 | 34 | 27 | 3900 | 3110 | 0.9 | 1.9 | 0.4 | 2.8 | 0.6 | 0.76 | -6 | 4.4 | |||||||
|
Lucan
|
300 | -17 | -19 | 30 | 23 | 34 | 26 | 3900 | 3110 | 0.9 | 2.3 | 0.4 | 3.3 | 0.6 | 0.8 | -6 | 4.6 | |||||||
|
Maitland
|
85 | -23 | -25 | 29 | 23 | 33 | 26 | 4080 | 3270 | 180 | 2.2 | 0.4 | 3.1 | 0.6 | 0.73 | -8 | 3.2 | |||||||
|
Markdale
|
425 | -20 | -22 | 29 | 22 | 33 | 25 | 4500 | 3650 | 0.9 | 3.2 | 0.4 | 4.6 | 0.6 | 0.67 | -6 | 3.6 | |||||||
|
Markham
|
175 | -21 | -23 | 31 | 24 | 35 | 27 | 4000 | 3200 | 0.8 | 1.3 | 0.4 | 1.9 | 0.6 | 0.73 | -6 | 4.2 | |||||||
|
Martin
|
485 | -35 | -37 | 29 | 22 | 33 | 25 | 5900 | 4950 | 0.8 | 2.6 | 0.3 | 3.7 | 0.4 | 0.52 | -11 | 2.8 | |||||||
|
Matheson
|
265 | -33 | -36 | 29 | 21 | 33 | 24 | 6080 | 5130 | 0.8 | 100 | 2.8 | 0.3 | 3.9 | 0.4 | 0.62 | -11 | 3.5 | ||||||
|
Mattawa
|
165 | -29 | -31 | 30 | 22 | 34 | 25 | 5050 | 4130 | 0.9 | 2.1 | 0.4 | 2.9 | 0.6 | 0.52 | -9 | 3.2 | |||||||
|
Midland
|
190 | -24 | -26 | 29 | 23 | 33 | 26 | 4200 | 3380 | 0.9 | 2.7 | 0.4 | 3.9 | 0.6 | 0.65 | -6 | 3.7 | |||||||
|
Milton
|
200 | -18 | -20 | 30 | 23 | 34 | 26 | 3920 | 3120 | 0.9 | 1.3 | 0.4 | 1.9 | 0.6 | 0.69 | -6 | 4.5 | |||||||
|
Milverton
|
370 | -19 | -21 | 29 | 23 | 33 | 26 | 4200 | 3380 | 0.9 | 2.4 | 0.4 | 3.5 | 0.6 | 0.69 | -6 | 4.6 | |||||||
|
Minden
|
270 | -27 | -29 | 29 | 23 | 33 | 26 | 4640 | 3780 | 0.9 | 2.7 | 0.4 | 3.7 | 0.6 | 0.58 | -8 | 2 | |||||||
|
Mississauga
|
160 | -18 | -20 | 30 | 23 | 34 | 26 | 3880 | 3090 | 0.9 | 1.1 | 0.4 | 1.6 | 0.6 | 0.73 | -5 | 5.2 | |||||||
|
Mississauga (Lester B. Pearson Int'l Airport)
|
170 | -20 | -22 | 31 | 24 | 35 | 27 | 3890 | – | 0.8 | 1.1 | 0.4 | 1.6 | 0.6 | 0.73 | -6 | 5.2 | |||||||
|
Mississauga (Port Credit)
|
75 | -18 | -20 | 29 | 23 | 33 | 26 | 3780 | 3000 | 0.9 | 0.9 | 0.4 | 1.3 | 0.6 | 0.8 | -6 | 5.2 | |||||||
|
Mitchell
|
335 | -18 | -20 | 29 | 23 | 33 | 26 | 4100 | 3290 | 0.9 | 2.4 | 0.4 | 3.5 | 0.6 | 0.74 | -6 | 4.5 | |||||||
|
Moosonee
|
10 | -36 | -38 | 28 | 22 | 32 | 25 | 6800 | 5820 | 0.8 | 2.7 | 0.3 | 3.8 | 0.4 | 0.58 | -12 | 4 | |||||||
|
Morrisburg
|
75 | -23 | -25 | 30 | 23 | 34 | 26 | 4370 | 3530 | 180 | 2.3 | 0.4 | 3.2 | 0.6 | 0.67 | -8 | 3.5 | |||||||
|
Mount Forest
|
420 | -21 | -24 | 28 | 22 | 32 | 25 | 4700 | 3830 | 0.9 | 2.7 | 0.4 | 3.9 | 0.6 | 0.67 | -7 | 3.3 | |||||||
|
Nakina
|
325 | -36 | -38 | 28 | 21 | 32 | 24 | 6500 | 5530 | 0.8 | 2.8 | 0.4 | 3.8 | 0.5 | 0.52 | -12 | 2.7 | |||||||
|
Nanticoke (Jarvis)
|
205 | -17 | -18 | 30 | 23 | 34 | 26 | 3700 | 2920 | 1 | 1.4 | 0.4 | 2.1 | 0.6 | 0.8 | -6 | 4.5 | |||||||
|
Nanticoke (Port Dover)
|
180 | -15 | -17 | 30 | 24 | 34 | 27 | 3600 | 2830 | 1 | 1.2 | 0.4 | 1.8 | 0.6 | 0.8 | -5 | 5 | |||||||
|
Napanee
|
90 | -22 | -24 | 29 | 23 | 33 | 26 | 4140 | 3320 | 0.9 | 1.9 | 0.4 | 2.8 | 0.6 | 0.69 | -7 | 4 | |||||||
|
Newcastle
|
115 | -20 | -22 | 30 | 23 | 34 | 26 | 3990 | 3190 | 0.9 | 1.5 | 0.4 | 2.2 | 0.6 | 0.8 | -6 | 4 | |||||||
|
Newcastle (Bowmanville)
|
95 | -20 | -22 | 30 | 23 | 34 | 26 | 4000 | – | 0.9 | 1.4 | 0.4 | 2 | 0.6 | 0.8 | -6 | 4 | |||||||
|
New Liskeard
|
180 | -32 | -35 | 30 | 22 | 34 | 25 | 5570 | 4630 | 0.8 | 2.6 | 0.4 | 3.6 | 0.6 | 0.69 | -11 | 4.2 | |||||||
|
Newmarket
|
185 | -22 | -24 | 30 | 23 | 34 | 26 | 4260 | 3430 | 0.8 | 2 | 0.4 | 2.9 | 0.6 | 0.62 | -7 | 3.5 | |||||||
|
Niagara Falls
|
210 | -16 | -18 | 30 | 23 | 34 | 26 | 3600 | 2830 | 0.9 | 1.8 | 0.4 | 2.7 | 0.6 | 0.69 | -5 | 4 | |||||||
|
North Bay
|
210 | -28 | -30 | 28 | 22 | 32 | 25 | 5150 | 4230 | 0.9 | 120 | 2.2 | 0.4 | 3 | 0.6 | 0.54 | -9 | 4.4 | ||||||
|
Norwood
|
225 | -24 | -26 | 30 | 23 | 34 | 26 | 4320 | 3490 | 0.8 | 2.1 | 0.4 | 3 | 0.6 | 0.67 | -7 | 2 | |||||||
|
Oakville
|
90 | -18 | -20 | 30 | 23 | 34 | 26 | 3760 | 2980 | 0.9 | 1.1 | 0.4 | 1.6 | 0.6 | 0.76 | -5 | 5.2 | |||||||
|
Orangeville
|
430 | -21 | -23 | 29 | 23 | 33 | 26 | 4450 | 3610 | 0.8 | 2.3 | 0.4 | 3.3 | 0.6 | 0.59 | -7 | 4 | |||||||
|
Orillia
|
230 | -25 | -27 | 29 | 23 | 33 | 26 | 4260 | 3430 | 0.9 | 2.4 | 0.4 | 3.4 | 0.6 | 0.59 | -7 | 3.5 | |||||||
|
Oshawa
|
110 | -19 | -21 | 30 | 23 | 34 | 26 | 3860 | 3070 | 0.9 | 1.4 | 0.4 | 2 | 0.6 | 0.8 | -6 | 4 | |||||||
|
Ottawa (Metropolitan)
|
||||||||||||||||||||||||
|
Ottawa (Barrhaven)
|
98 | -25 | -27 | 30 | 23 | 34 | 26 | 4500 | 3600 | 160 | 2.4 | 0.4 | 3.5 | 0.6 | 0.67 | -8 | 4.4 | |||||||
|
Ottawa (City Hall)
|
70 | -25 | -27 | 30 | 23 | 34 | 26 | 4440 | 3650 | 160 | 2.4 | 0.4 | 3.4 | 0.6 | 0.67 | -8 | 3.5 | |||||||
|
Ottawa (Kanata)
|
98 | -25 | -27 | 30 | 23 | 34 | 26 | 4520 | 3670 | 160 | 2.5 | 0.4 | 3.6 | 0.6 | 0.67 | -8 | 4.4 | |||||||
|
Ottawa (M-C Int'l Airport)
|
125 | -25 | -27 | 30 | 23 | 34 | 26 | 4500 | 3650 | 160 | 2.4 | 0.4 | 3.5 | 0.6 | 0.67 | -8 | 4.4 | |||||||
|
Ottawa (Orléans)
|
70 | -26 | -28 | 30 | 23 | 33 | 26 | 4500 | 3650 | 160 | 2.4 | 0.4 | 3.4 | 0.6 | 0.67 | -8 | 3.5 | |||||||
|
Owen Sound
|
215 | -19 | -21 | 29 | 22 | 33 | 25 | 4030 | 3220 | 0.9 | 2.8 | 0.4 | 4 | 0.6 | 0.73 | -6 | 4 | |||||||
|
Pagwa River
|
185 | -35 | -37 | 28 | 21 | 32 | 24 | 6500 | 5530 | 0.8 | 80 | 2.7 | 0.4 | 3.6 | 0.5 | 0.52 | -12 | 2.7 | ||||||
|
Paris
|
245 | -18 | -20 | 30 | 23 | 34 | 26 | 4000 | 3200 | 0.9 | 1.4 | 0.4 | 2 | 0.6 | 0.68 | -6 | 4.2 | |||||||
|
Parkhill
|
205 | -16 | -18 | 31 | 23 | 35 | 26 | 3800 | 3010 | 0.9 | 2.1 | 0.4 | 3.1 | 0.6 | 0.8 | -6 | 5 | |||||||
|
Parry Sound
|
215 | -24 | -26 | 28 | 22 | 32 | 25 | 4640 | 3780 | 1 | 2.8 | 0.4 | 4 | 0.6 | 0.65 | -8 | 3.7 | |||||||
|
Pelham (Fonthill)
|
230 | -15 | -17 | 30 | 23 | 34 | 26 | 3690 | 2910 | 0.9 | 2.1 | 0.4 | 3.1 | 0.6 | 0.68 | -6 | 4 | |||||||
|
Pembroke
|
125 | -28 | -31 | 30 | 23 | 34 | 26 | 4980 | 4090 | 0.8 | 100 | 2.5 | 0.4 | 3.5 | 0.6 | 0.58 | -9 | 2.7 | ||||||
|
Penetanguishene
|
220 | -24 | -26 | 29 | 23 | 33 | 26 | 4200 | 3380 | 0.9 | 2.8 | 0.4 | 4 | 0.6 | 0.65 | -7 | 3.7 | |||||||
|
Perth
|
130 | -25 | -27 | 30 | 23 | 34 | 26 | 4540 | 3690 | 0.8 | 140 | 2.3 | 0.4 | 3.3 | 0.6 | 0.67 | -8 | 2.3 | ||||||
|
Petawawa
|
135 | -29 | -31 | 30 | 23 | 34 | 26 | 4980 | 4090 | 0.8 | 100 | 2.6 | 0.4 | 3.6 | 0.6 | 0.58 | -9 | 2.7 | ||||||
|
Peterborough
|
200 | -23 | -25 | 30 | 23 | 34 | 26 | 4400 | 3560 | 0.8 | 2 | 0.4 | 2.9 | 0.6 | 0.67 | -7 | 2.8 | |||||||
|
Petrolia
|
195 | -16 | -18 | 31 | 24 | 34 | 27 | 3640 | 2870 | 0.9 | 1.3 | 0.4 | 1.9 | 0.6 | 0.76 | -6 | 4.2 | |||||||
|
Pickering (Dunbarton)
|
85 | -19 | -21 | 30 | 23 | 34 | 26 | 3800 | 3010 | 0.9 | 1 | 0.4 | 1.5 | 0.6 | 0.8 | -6 | 4 | |||||||
|
Picton
|
95 | -21 | -23 | 29 | 23 | 33 | 26 | 3980 | 3180 | 0.9 | 2 | 0.4 | 2.9 | 0.6 | 0.81 | -6 | 4.5 | |||||||
|
Plattsville
|
300 | -19 | -21 | 29 | 23 | 33 | 26 | 4150 | 3330 | 0.9 | 1.9 | 0.4 | 2.8 | 0.6 | 0.68 | -6 | 4.2 | |||||||
|
Point Alexander
|
150 | -29 | -32 | 30 | 22 | 34 | 25 | 4960 | 4040 | 0.8 | 2.5 | 0.4 | 3.5 | 0.6 | 0.58 | -9 | 3.2 | |||||||
|
Port Burwell
|
195 | -15 | -17 | 30 | 24 | 34 | 27 | 3800 | 3010 | 1.1 | 1.2 | 0.4 | 1.7 | 0.6 | 0.76 | -5 | 5 | |||||||
|
Port Colborne
|
180 | -15 | -17 | 30 | 24 | 34 | 27 | 3600 | 2830 | 1 | 2.1 | 0.4 | 3.1 | 0.6 | 0.75 | -5 | 5 | |||||||
|
Port Elgin
|
205 | -17 | -19 | 28 | 22 | 32 | 25 | 4100 | 3290 | 0.9 | 2.8 | 0.4 | 4 | 0.6 | 0.8 | -6 | 5.3 | |||||||
|
Port Hope
|
100 | -21 | -23 | 29 | 23 | 33 | 26 | 3970 | 3170 | 0.9 | 1.2 | 0.4 | 1.7 | 0.6 | 0.8 | -6 | 4 | |||||||
|
Port Perry
|
270 | -22 | -24 | 30 | 23 | 34 | 26 | 4260 | 3430 | 0.8 | 2.4 | 0.4 | 3.5 | 0.6 | 0.73 | -7 | 3.4 | |||||||
|
Port Stanley
|
180 | -15 | -17 | 31 | 24 | 35 | 27 | 3850 | 3060 | 1.1 | 1.2 | 0.4 | 1.7 | 0.6 | 0.76 | -5 | 5 | |||||||
|
Prescott
|
90 | -23 | -25 | 29 | 23 | 33 | 26 | 4120 | 3310 | 180 | 2.2 | 0.4 | 3.1 | 0.6 | 0.73 | -8 | 3.2 | |||||||
|
Princeton
|
280 | -18 | -20 | 30 | 23 | 34 | 26 | 4000 | 3200 | 0.9 | 1.5 | 0.4 | 2.2 | 0.6 | 0.68 | -6 | 4.2 | |||||||
|
Raith
|
475 | -34 | -37 | 28 | 22 | 32 | 25 | 5900 | 4950 | 0.8 | 2.7 | 0.4 | 3.8 | 0.6 | 0.52 | -11 | 2.3 | |||||||
|
Rayside-Balfour (Chelmsford)
|
270 | -28 | -30 | 29 | 21 | 33 | 24 | 5200 | 4280 | 0.8 | 2.5 | 0.4 | 3.5 | 0.6 | 0.74 | -9 | 3.8 | |||||||
|
Red Lake
|
360 | -35 | -37 | 28 | 21 | 32 | 26 | 6220 | 5290 | 0.7 | 2.6 | 0.3 | 3.7 | 0.4 | 0.52 | -11 | 3.5 | |||||||
|
Renfrew
|
115 | -27 | -30 | 30 | 23 | 34 | 26 | 4900 | 4020 | 140 | 2.5 | 0.4 | 3.5 | 0.6 | 0.58 | -9 | 3.5 | |||||||
|
Richmond Hill
|
230 | -21 | -23 | 31 | 24 | 35 | 27 | 4000 | 3200 | 0.8 | 1.5 | 0.4 | 2.2 | 0.6 | 0.73 | -6 | 3.5 | |||||||
|
Rockland
|
50 | -26 | -28 | 30 | 23 | 34 | 26 | 4600 | 3740 | 160 | 2.4 | 0.4 | 3.3 | 0.6 | 0.67 | -8 | 3.5 | |||||||
|
Sarnia
|
190 | -16 | -18 | 31 | 24 | 34 | 27 | 3750 | 2970 | 0.9 | 1.1 | 0.4 | 1.6 | 0.6 | 0.76 | -6 | 4.7 | |||||||
|
Sault Ste. Marie
|
190 | -25 | -28 | 29 | 22 | 33 | 25 | 4960 | 4040 | 3.1 | 0.4 | 4.5 | 0.6 | 0.75 | -8 | 4.1 | ||||||||
|
Schreiber
|
310 | -34 | -36 | 27 | 21 | 31 | 24 | 5960 | 5010 | 0.8 | 3.3 | 0.4 | 4.7 | 0.6 | 0.67 | -10 | 3 | |||||||
|
Seaforth
|
310 | -17 | -19 | 30 | 23 | 34 | 26 | 4100 | 3290 | 0.9 | 2.5 | 0.4 | 3.6 | 0.6 | 0.74 | -6 | 5 | |||||||
|
Shelburne
|
495 | -22 | -24 | 29 | 23 | 33 | 26 | 4700 | 3830 | 0.9 | 3.1 | 0.4 | 4.4 | 0.6 | 0.67 | -7 | 3.5 | |||||||
|
Simcoe
|
210 | -17 | -19 | 30 | 24 | 34 | 27 | 3700 | 2920 | 1 | 1.3 | 0.4 | 1.9 | 0.6 | 0.74 | -6 | 4 | |||||||
|
Sioux Lookout
|
375 | -34 | -36 | 28 | 22 | 32 | 25 | 5950 | 5030 | 0.7 | 2.6 | 0.3 | 3.7 | 0.4 | 0.52 | -12 | 3 | |||||||
|
Smiths Falls
|
130 | -25 | -27 | 30 | 23 | 34 | 26 | 4540 | 3690 | 140 | 2.3 | 0.4 | 3.3 | 0.6 | 0.67 | -8 | 2.5 | |||||||
|
Smithville
|
185 | -16 | -18 | 30 | 23 | 34 | 26 | 3650 | 2880 | 0.9 | 1.5 | 0.4 | 2.2 | 0.6 | 0.68 | -6 | 4.2 | |||||||
|
Smooth Rock Falls
|
235 | -34 | -36 | 29 | 21 | 33 | 24 | 6250 | 5290 | 0.8 | 80 | 2.7 | 0.3 | 3.8 | 0.4 | 0.5 | -11 | 3.9 | ||||||
|
Southampton
|
180 | -17 | -19 | 28 | 22 | 32 | 25 | 4100 | 3290 | 1 | 2.7 | 0.4 | 3.9 | 0.6 | 0.8 | -6 | 5.3 | |||||||
|
South River
|
355 | -27 | -29 | 29 | 22 | 33 | 25 | 5090 | 4190 | 1 | 120 | 2.8 | 0.4 | 3.9 | 0.6 | 0.58 | -9 | 2.5 | ||||||
|
St. Catharines
|
105 | -16 | -18 | 30 | 23 | 34 | 26 | 3540 | 2780 | 0.9 | 1 | 0.4 | 1.5 | 0.6 | 0.75 | -5 | 4.5 | |||||||
|
St. Marys
|
310 | -18 | -20 | 30 | 23 | 34 | 26 | 4000 | 3200 | 1 | 2.2 | 0.4 | 3.2 | 0.6 | 0.76 | -6 | 4.5 | |||||||
|
St. Thomas
|
225 | -16 | -18 | 31 | 24 | 35 | 27 | 3780 | 3000 | 1 | 1.4 | 0.4 | 2 | 0.6 | 0.76 | -6 | 4.7 | |||||||
|
Stirling
|
120 | -23 | -25 | 30 | 23 | 34 | 26 | 4220 | 3400 | 0.9 | 1.7 | 0.4 | 2.4 | 0.6 | 0.67 | -7 | 2.2 | |||||||
|
Stratford
|
360 | -18 | -20 | 29 | 23 | 33 | 26 | 4050 | 3240 | 1 | 2.3 | 0.4 | 3.4 | 0.6 | 0.74 | -6 | 4.5 | |||||||
|
Strathroy
|
225 | -17 | -19 | 31 | 24 | 35 | 27 | 3780 | 3000 | 0.9 | 1.9 | 0.4 | 2.8 | 0.6 | 0.76 | -6 | 4.7 | |||||||
|
Sturgeon Falls
|
205 | -28 | -30 | 29 | 21 | 33 | 24 | 5200 | 4280 | 0.9 | 140 | 2.4 | 0.4 | 3.3 | 0.6 | 0.58 | -9 | 4.4 | ||||||
|
Sudbury
|
275 | -28 | -30 | 29 | 21 | 33 | 24 | 5180 | 4260 | 0.8 | 2.5 | 0.4 | 3.6 | 0.6 | 0.75 | -9 | 4.5 | |||||||
|
Sundridge
|
340 | -27 | -29 | 29 | 22 | 33 | 25 | 5080 | 4180 | 1 | 120 | 2.8 | 0.4 | 3.9 | 0.6 | 0.58 | -9 | 2.5 | ||||||
|
Tavistock
|
340 | -19 | -21 | 29 | 23 | 33 | 26 | 4100 | 3290 | 1 | 2.1 | 0.4 | 3 | 0.6 | 0.74 | -6 | 4.5 | |||||||
|
Temagami
|
300 | -30 | -33 | 30 | 22 | 34 | 25 | 5420 | 4490 | 0.8 | 2.6 | 0.4 | 3.6 | 0.6 | 0.61 | -10 | 3.9 | |||||||
|
Thamesford
|
280 | -19 | -21 | 30 | 23 | 34 | 26 | 3950 | 3150 | 0.9 | 1.9 | 0.4 | 2.7 | 0.6 | 0.8 | -6 | 4.4 | |||||||
|
Thedford
|
205 | -16 | -18 | 31 | 23 | 35 | 26 | 3710 | 2930 | 2.1 | 0.4 | 3.1 | 0.6 | 0.8 | -6 | 5 | ||||||||
|
Thunder Bay
|
210 | -31 | -33 | 29 | 21 | 33 | 24 | 5650 | 4710 | 0.8 | 2.9 | 0.4 | 4.2 | 0.6 | 0.67 | -10 | 3.3 | |||||||
|
Tillsonburg
|
215 | -17 | -19 | 30 | 24 | 34 | 27 | 3840 | 3050 | 1 | 1.3 | 0.4 | 1.9 | 0.6 | 0.73 | -6 | 3.5 | |||||||
|
Timmins
|
300 | -34 | -36 | 29 | 21 | 33 | 24 | 5940 | 4990 | 0.8 | 100 | 3.1 | 0.3 | 4.3 | 0.4 | 0.55 | -11 | 3.5 | ||||||
|
Timmins (Porcupine)
|
295 | -34 | -36 | 29 | 21 | 33 | 24 | 6000 | 5050 | 0.8 | 100 | 2.9 | 0.3 | 4 | 0.4 | 0.58 | -11 | 3.5 | ||||||
|
Toronto Metropolitan Region
|
||||||||||||||||||||||||
|
Etobicoke
|
160 | -20 | -22 | 31 | 24 | 35 | 27 | 3800 | 3010 | 0.8 | 1.1 | 0.4 | 1.6 | 0.6 | 0.73 | -6 | 4 | |||||||
|
North York
|
175 | -20 | -22 | 31 | 24 | 35 | 27 | 3760 | 2980 | 0.8 | 1.2 | 0.4 | 1.7 | 0.6 | 0.73 | -6 | 4 | |||||||
|
Scarborough
|
180 | -20 | -22 | 31 | 24 | 35 | 27 | 3800 | 3010 | 0.9 | 1.2 | 0.4 | 1.8 | 0.6 | 0.76 | -6 | 4 | |||||||
|
Toronto (City Hall)
|
90 | -18 | -20 | 31 | 23 | 35 | 26 | 3520 | 2760 | 0.9 | 0.9 | 0.4 | 1.3 | 0.6 | 0.73 | -5 | 4 | |||||||
|
Trenton
|
80 | -22 | -24 | 29 | 23 | 33 | 26 | 4110 | 3300 | 0.9 | 1.6 | 0.4 | 2.3 | 0.6 | 0.76 | -6 | 4 | |||||||
|
Trout Creek
|
330 | -27 | -29 | 29 | 22 | 33 | 25 | 5100 | 4200 | 0.9 | 120 | 2.7 | 0.4 | 3.7 | 0.6 | 0.58 | -9 | 2.5 | ||||||
|
Uxbridge
|
275 | -22 | -24 | 30 | 23 | 34 | 26 | 4240 | 3410 | 0.8 | 2.4 | 0.4 | 3.5 | 0.6 | 0.68 | -7 | 3.4 | |||||||
|
Vaughan (Woodbridge)
|
165 | -20 | -22 | 31 | 24 | 35 | 27 | 4100 | 3290 | 0.8 | 1.1 | 0.4 | 1.6 | 0.6 | 0.73 | -6 | 4 | |||||||
|
Vittoria
|
215 | -15 | -17 | 30 | 24 | 34 | 27 | 3680 | 2900 | 1 | 1.3 | 0.4 | 1.9 | 0.6 | 0.76 | -6 | 4.8 | |||||||
|
Walkerton
|
275 | -18 | -20 | 30 | 22 | 34 | 25 | 4300 | 3470 | 0.9 | 2.7 | 0.4 | 3.9 | 0.6 | 0.75 | -7 | 3.8 | |||||||
|
Wallaceburg
|
180 | -16 | -18 | 31 | 24 | 34 | 27 | 3600 | 2830 | 0.9 | 0.9 | 0.4 | 1.3 | 0.6 | 0.74 | -6 | 4.5 | |||||||
|
Waterloo
|
330 | -19 | -21 | 29 | 23 | 33 | 26 | 4200 | 3380 | 0.9 | 2 | 0.4 | 2.9 | 0.6 | 0.61 | -6 | 4.5 | |||||||
|
Watford
|
240 | -17 | -19 | 31 | 24 | 35 | 27 | 3740 | 2960 | 0.9 | 1.9 | 0.4 | 2.8 | 0.6 | 0.76 | -6 | 4.5 | |||||||
|
Wawa
|
290 | -34 | -36 | 26 | 21 | 30 | 24 | 5840 | 4900 | 0.9 | 3.4 | 0.4 | 4.8 | 0.6 | 0.65 | -10 | 3.5 | |||||||
|
Welland
|
180 | -15 | -17 | 30 | 23 | 34 | 26 | 3670 | 2900 | 1 | 2 | 0.4 | 3 | 0.6 | 0.69 | -6 | 4 | |||||||
|
West Lorne
|
215 | -16 | -18 | 31 | 24 | 35 | 27 | 3700 | 2920 | 1 | 1.3 | 0.4 | 1.9 | 0.6 | 0.76 | -6 | 5 | |||||||
|
Whitby
|
85 | -20 | -22 | 30 | 23 | 34 | 26 | 3820 | 3030 | 0.9 | 1.2 | 0.4 | 1.8 | 0.6 | 0.8 | -6 | 4 | |||||||
|
Whitby (Brooklin)
|
160 | -20 | -22 | 30 | 23 | 34 | 26 | 4010 | 3210 | 0.9 | 1.9 | 0.4 | 2.8 | 0.6 | 0.74 | -6 | 3.8 | |||||||
|
White River
|
375 | -39 | -42 | 28 | 21 | 32 | 24 | 6150 | 5200 | 0.8 | 3.6 | 0.4 | 5 | 0.6 | 0.52 | -11 | 3 | |||||||
|
Wiarton
|
185 | -19 | -21 | 29 | 22 | 33 | 25 | 4300 | 3470 | 0.9 | 2.7 | 0.4 | 3.9 | 0.6 | 0.73 | -6 | 4.1 | |||||||
|
Windsor
|
185 | -16 | -18 | 32 | 24 | 35 | 27 | 3400 | 2650 | 0.9 | 0.8 | 0.4 | 1.2 | 0.6 | 0.76 | -5 | 5 | |||||||
|
Wingham
|
310 | -18 | -20 | 30 | 23 | 34 | 26 | 4220 | 3400 | 0.9 | 2.6 | 0.4 | 3.8 | 0.6 | 0.75 | -6 | 4 | |||||||
|
Woodstock
|
300 | -19 | -21 | 30 | 23 | 34 | 26 | 3910 | 3110 | 0.9 | 1.9 | 0.4 | 2.7 | 0.6 | 0.73 | -6 | 4.2 | |||||||
|
Wyoming
|
215 | -16 | -18 | 31 | 24 | 34 | 27 | 3700 | 2920 | 0.9 | 1.6 | 0.4 | 2.4 | 0.6 | 0.76 | -6 | 4.2 | |||||||
| Québec | ||||||||||||||||||||||||
|
Acton Vale
|
95 | -24 | -27 | 30 | 23 | 34 | 26 | 4620 | 3790 | 180 | 2.3 | 0.4 | 3.4 | 0.6 | 0.55 | -8 | 3.5 | |||||||
|
Alma
|
110 | -31 | -33 | 28 | 22 | 32 | 25 | 5800 | 4860 | 3.3 | 0.4 | 4.6 | 0.6 | 0.55 | -11 | 3.8 | ||||||||
|
Amos
|
295 | -34 | -36 | 28 | 21 | 32 | 24 | 6160 | 5210 | 0.9 | 100 | 3.2 | 0.3 | 4.3 | 0.4 | 0.47 | -11 | 3.8 | ||||||
|
Aylmer
|
90 | -25 | -28 | 30 | 23 | 34 | 26 | 4520 | 3620 | 160 | 2.5 | 0.4 | 3.6 | 0.6 | 0.64 | -8 | 3.5 | |||||||
|
Baie-Comeau
|
60 | -27 | -29 | 25 | 19 | 29 | 22 | 6020 | 5070 | 4.3 | 0.4 | 6.2 | 0.6 | 0.75 | -9 | 4.8 | ||||||||
|
Baie-Saint-Paul
|
20 | -27 | -29 | 28 | 21 | 32 | 24 | 5280 | 4350 | 3.4 | 0.6 | 4.8 | 0.8 | 0.73 | -10 | 3.5 | ||||||||
|
Beauport
|
45 | -26 | -29 | 28 | 22 | 32 | 25 | 5100 | 4180 | 3.4 | 0.6 | 4.8 | 0.8 | 0.65 | -9 | 4 | ||||||||
|
Bedford
|
55 | -24 | -26 | 29 | 23 | 33 | 26 | 4420 | 3610 | 160 | 2.1 | 0.4 | 3.1 | 0.6 | 0.58 | -8 | 2.8 | |||||||
|
Beloeil
|
25 | -24 | -26 | 30 | 23 | 34 | 26 | 4500 | 3680 | 2.4 | 0.4 | 3.6 | 0.6 | 0.58 | -8 | 3.5 | ||||||||
|
Brome
|
210 | -25 | -27 | 29 | 23 | 33 | 26 | 4730 | 3880 | 160 | 2.5 | 0.4 | 3.6 | 0.6 | 0.58 | -8 | 3 | |||||||
|
Brossard
|
15 | -24 | -26 | 30 | 23 | 34 | 26 | 4420 | 3610 | 2.4 | 0.4 | 3.6 | 0.6 | 0.69 | -8 | 4.3 | ||||||||
|
Buckingham
|
130 | -26 | -28 | 30 | 23 | 33 | 26 | 4880 | 3970 | 160 | 2.6 | 0.4 | 3.6 | 0.6 | 0.64 | -8 | 2.2 | |||||||
|
Campbell's Bay
|
115 | -28 | -30 | 30 | 23 | 34 | 26 | 4900 | 3980 | 140 | 2.6 | 0.4 | 3.6 | 0.6 | 0.5 | -9 | 2.8 | |||||||
|
Chambly
|
20 | -24 | -26 | 30 | 23 | 34 | 26 | 4450 | 3630 | 2.3 | 0.4 | 3.4 | 0.6 | 0.64 | -8 | 3.5 | ||||||||
|
Coaticook
|
295 | -25 | -27 | 28 | 22 | 32 | 25 | 4750 | 3840 | 2.3 | 0.6 | 3.3 | 0.9 | 0.55 | -8 | 3 | ||||||||
|
Contrecoeur
|
10 | -25 | -27 | 30 | 23 | 34 | 26 | 4500 | 3680 | 2.8 | 0.4 | 4.1 | 0.6 | 0.66 | -8 | 3.5 | ||||||||
|
Cowansville
|
120 | -25 | -27 | 29 | 23 | 33 | 26 | 4540 | 3710 | 160 | 2.3 | 0.4 | 3.4 | 0.6 | 0.58 | -8 | 2.8 | |||||||
|
Deux-Montagnes
|
25 | -25 | -27 | 29 | 23 | 33 | 26 | 4440 | 3630 | 2.4 | 0.4 | 3.5 | 0.6 | 0.58 | -8 | 3.5 | ||||||||
|
Dolbeau
|
120 | -32 | -34 | 28 | 22 | 32 | 25 | 6250 | 5290 | 3.5 | 0.3 | 4.8 | 0.4 | 0.53 | -12 | 3.8 | ||||||||
|
Drummondville
|
85 | -26 | -28 | 30 | 23 | 34 | 26 | 4700 | 3860 | 180 | 2.5 | 0.4 | 3.6 | 0.6 | 0.55 | -9 | 3.8 | |||||||
|
Farnham
|
60 | -24 | -26 | 29 | 23 | 33 | 26 | 4500 | 3680 | 180 | 2.5 | 0.4 | 3.7 | 0.6 | 0.58 | -8 | 2.8 | |||||||
|
Fort-Coulonge
|
110 | -28 | -30 | 30 | 23 | 34 | 26 | 4950 | 4030 | 0.9 | 100 | 2.5 | 0.4 | 3.5 | 0.6 | 0.5 | -9 | 3 | ||||||
|
Gagnon
|
545 | -34 | -36 | 24 | 19 | 28 | 22 | 7600 | 6600 | 4.6 | 0.4 | 6.4 | 0.6 | 0.6 | -14 | 3.7 | ||||||||
|
Gaspé
|
55 | -25 | -26 | 26 | 20 | 30 | 23 | 5500 | 4570 | 4.3 | 0.6 | 6.2 | 0.9 | 0.73 | -8 | 3.5 | ||||||||
|
Gatineau
|
95 | -25 | -28 | 30 | 23 | 34 | 26 | 4600 | 3690 | 160 | 2.5 | 0.4 | 3.6 | 0.6 | 0.64 | -8 | 3.2 | |||||||
|
Gracefield
|
175 | -28 | -31 | 30 | 23 | 34 | 26 | 5080 | 4160 | 0.9 | 140 | 2.6 | 0.4 | 3.7 | 0.6 | 0.5 | -9 | 2.2 | ||||||
|
Granby
|
120 | -25 | -27 | 29 | 23 | 33 | 26 | 4500 | 3680 | 160 | 2.3 | 0.4 | 3.4 | 0.6 | 0.55 | -8 | 2.5 | |||||||
|
Harrington Harbour
|
30 | -27 | -29 | 19 | 16 | 23 | 20 | 6150 | 5200 | 4.9 | 0.6 | 7 | 0.9 | 1.03 | -9 | 5 | ||||||||
|
Havre-Saint-Pierre
|
5 | -27 | -29 | 22 | 18 | 26 | 22 | 6100 | 5150 | 4.1 | 0.6 | 5.9 | 0.9 | 0.95 | -9 | 5 | ||||||||
|
Hemmingford
|
75 | -24 | -26 | 30 | 23 | 34 | 26 | 4380 | 3570 | 160 | 2.4 | 0.4 | 3.6 | 0.6 | 0.64 | -8 | 3 | |||||||
|
Hull
|
65 | -25 | -28 | 30 | 23 | 34 | 26 | 4550 | 3650 | 160 | 2.4 | 0.4 | 3.5 | 0.6 | 0.64 | -8 | 3.2 | |||||||
|
Iberville
|
35 | -24 | -26 | 29 | 23 | 33 | 26 | 4450 | 3630 | 160 | 2.2 | 0.4 | 3.3 | 0.6 | 0.64 | -8 | 3 | |||||||
|
Inukjuak
|
5 | -36 | -38 | 21 | 15 | 26 | 19 | 9150 | 8100 | 0.9 | 4.1 | 0.2 | 5.9 | 0.3 | 0.69 | -15 | 5.4 | |||||||
|
Joliette
|
45 | -26 | -28 | 29 | 23 | 33 | 26 | 4720 | 3870 | 3.1 | 0.4 | 4.4 | 0.6 | 0.57 | -8 | 2.5 | ||||||||
|
Kuujjuaq
|
25 | -37 | -39 | 24 | 17 | 29 | 21 | 8550 | 7520 | 0.8 | 4.8 | 0.2 | 7.1 | 0.3 | 0.85 | -14 | 4 | |||||||
|
Kuujjuarapik
|
20 | -36 | -38 | 25 | 17 | 29 | 20 | 7990 | 6980 | 0.9 | 4.2 | 0.3 | 6 | 0.4 | 0.69 | -13 | 4.6 | |||||||
|
Lachute
|
65 | -26 | -28 | 29 | 23 | 33 | 26 | 4640 | 4570 | 2.4 | 0.4 | 3.4 | 0.6 | 0.64 | -8 | 2.8 | ||||||||
|
Lac-Mégantic
|
420 | -27 | -29 | 27 | 22 | 31 | 25 | 5180 | 4470 | 160 | 3.2 | 0.6 | 4.6 | 0.9 | 0.55 | -8 | 3.5 | |||||||
|
La Malbaie
|
25 | -26 | -28 | 28 | 21 | 32 | 24 | 5400 | 3800 | 3.1 | 0.6 | 4.3 | 0.8 | 0.73 | -9 | 3.5 | ||||||||
|
La Pocatière
|
55 | -24 | -26 | 28 | 22 | 32 | 25 | 5160 | 4240 | 3.2 | 0.6 | 4.5 | 0.9 | 0.75 | -8 | 4.3 | ||||||||
|
La Tuque
|
165 | -30 | -32 | 29 | 22 | 33 | 25 | 5500 | 4260 | 3.4 | 0.4 | 4.7 | 0.6 | 0.53 | -10 | 2.1 | ||||||||
|
Lennoxville
|
155 | -28 | -30 | 29 | 22 | 33 | 25 | 4700 | 3790 | 160 | 2.1 | 0.6 | 3.1 | 0.9 | 0.5 | -8 | 2.9 | |||||||
|
Léry
|
30 | -24 | -26 | 29 | 23 | 33 | 26 | 4420 | 3610 | 2.3 | 0.4 | 3.4 | 0.6 | 0.65 | -8 | 3.5 | ||||||||
|
Loretteville
|
100 | -26 | -29 | 28 | 22 | 32 | 25 | 5200 | 4280 | 3.7 | 0.6 | 5.1 | 0.8 | 0.64 | -9 | 3 | ||||||||
|
Louiseville
|
15 | -25 | -28 | 29 | 23 | 33 | 26 | 4900 | 4030 | 160 | 2.9 | 0.4 | 4.1 | 0.6 | 0.66 | -9 | 3 | |||||||
|
Magog
|
215 | -26 | -28 | 29 | 23 | 33 | 26 | 4730 | 3880 | 160 | 2.3 | 0.4 | 3.4 | 0.6 | 0.55 | -8 | 3.5 | |||||||
|
Malartic
|
325 | -33 | -36 | 29 | 21 | 33 | 24 | 6200 | 5240 | 0.8 | 3.3 | 0.3 | 4.4 | 0.4 | 0.47 | -11 | 3.6 | |||||||
|
Maniwaki
|
180 | -30 | -32 | 29 | 22 | 33 | 25 | 5280 | 4350 | 0.9 | 2.4 | 0.4 | 3.4 | 0.6 | 0.49 | -9 | 2.2 | |||||||
|
Masson
|
50 | -26 | -28 | 30 | 23 | 33 | 26 | 4610 | 3700 | 160 | 2.4 | 0.4 | 3.3 | 0.6 | 0.64 | -8 | 3.2 | |||||||
|
Matane
|
5 | -24 | -26 | 24 | 20 | 28 | 23 | 5510 | 4580 | 3.7 | 0.4 | 5.3 | 0.6 | 0.82 | -8 | 6 | ||||||||
|
Mont-Joli
|
90 | -24 | -26 | 26 | 21 | 30 | 24 | 5370 | 4440 | 4.1 | 0.4 | 6 | 0.6 | 0.77 | -8 | 5.9 | ||||||||
|
Mont-Laurier
|
225 | -29 | -32 | 29 | 22 | 33 | 25 | 5320 | 4390 | 0.9 | 2.6 | 0.4 | 3.6 | 0.6 | 0.47 | -10 | 2.2 | |||||||
|
Montmagny
|
10 | -25 | -28 | 28 | 22 | 32 | 25 | 5090 | 4170 | 2.9 | 0.6 | 4 | 0.8 | 0.73 | -9 | 4 | ||||||||
|
Montréal Region
|
||||||||||||||||||||||||
|
Beaconsfield
|
25 | -24 | -26 | 30 | 23 | 34 | 26 | 4440 | 3630 | 2.3 | 0.4 | 3.4 | 0.6 | 0.65 | -8 | 3.5 | ||||||||
|
Dorval
|
25 | -24 | -26 | 30 | 23 | 34 | 26 | 4400 | 3590 | 2.4 | 0.4 | 3.3 | 0.6 | 0.69 | -8 | 4 | ||||||||
|
Laval
|
35 | -24 | -26 | 29 | 23 | 33 | 26 | 4500 | 3680 | 2.6 | 0.4 | 3.9 | 0.6 | 0.65 | -8 | 3.5 | ||||||||
|
Montréal (City Hall)
|
20 | -23 | -26 | 30 | 23 | 34 | 26 | 4200 | 3410 | 2.6 | 0.4 | 4 | 0.6 | 0.69 | -8 | 3.5 | ||||||||
|
Montréal-Est
|
25 | -23 | -26 | 30 | 23 | 34 | 26 | 4470 | 3650 | 2.7 | 0.4 | 4 | 0.6 | 0.69 | -8 | 3.5 | ||||||||
|
Montréal-Nord
|
20 | -24 | -26 | 30 | 23 | 34 | 26 | 4470 | 3650 | 2.6 | 0.4 | 3.9 | 0.6 | 0.65 | -8 | 3.5 | ||||||||
|
Outremont
|
105 | -23 | -26 | 30 | 23 | 34 | 26 | 4300 | 3500 | 2.8 | 0.4 | 4.2 | 0.6 | 0.69 | -8 | 3.5 | ||||||||
|
Pierrefonds
|
25 | -24 | -26 | 30 | 23 | 34 | 26 | 4430 | 3620 | 2.4 | 0.4 | 3.5 | 0.6 | 0.65 | -8 | 3.5 | ||||||||
|
Sainte-Anne-de-Bellevue
|
35 | -24 | -26 | 29 | 23 | 33 | 26 | 4460 | 3640 | 2.3 | 0.4 | 3.4 | 0.6 | 0.65 | -8 | 3.3 | ||||||||
|
Saint-Lambert
|
15 | -23 | -26 | 30 | 23 | 34 | 26 | 4400 | 3590 | 2.5 | 0.4 | 3.8 | 0.6 | 0.69 | -8 | 4 | ||||||||
|
Saint-Laurent
|
45 | -23 | -26 | 30 | 23 | 34 | 26 | 4270 | 3470 | 2.5 | 0.4 | 3.7 | 0.6 | 0.69 | -8 | 3.5 | ||||||||
|
Verdun
|
20 | -23 | -26 | 30 | 23 | 34 | 26 | 4200 | 3410 | 2.5 | 0.4 | 3.8 | 0.6 | 0.69 | -8 | 3.5 | ||||||||
|
Nicolet (Gentilly)
|
15 | -25 | -28 | 29 | 23 | 33 | 26 | 4900 | 3980 | 2.8 | 0.4 | 4 | 0.6 | 0.65 | -9 | 3.5 | ||||||||
|
Nitchequon
|
545 | -39 | -41 | 23 | 19 | 27 | 22 | 8100 | 7080 | 3.5 | 0.3 | 4.6 | 0.4 | 0.55 | -14 | 3.7 | ||||||||
|
Noranda
|
305 | -33 | -36 | 29 | 21 | 33 | 24 | 6050 | 5100 | 0.8 | 3.2 | 0.3 | 4.3 | 0.4 | 0.53 | -11 | 3.5 | |||||||
|
Percé
|
5 | -21 | -24 | 25 | 19 | 29 | 23 | 5400 | 4470 | 3.8 | 0.6 | 5.5 | 0.9 | 0.95 | -7 | 5.1 | ||||||||
|
Pincourt
|
25 | -24 | -26 | 29 | 23 | 33 | 26 | 4480 | 3660 | 2.3 | 0.4 | 3.4 | 0.6 | 0.65 | -8 | 3.3 | ||||||||
|
Plessisville
|
145 | -26 | -28 | 29 | 23 | 33 | 26 | 5100 | 4180 | 180 | 2.8 | 0.6 | 4.1 | 0.9 | 0.55 | -9 | 3.2 | |||||||
|
Port-Cartier
|
20 | -28 | -30 | 25 | 19 | 29 | 22 | 6060 | 5110 | 4.1 | 0.4 | 5.8 | 0.6 | 0.8 | -9 | 4 | ||||||||
|
Puvirnituq
|
5 | -36 | -38 | 23 | 16 | 29 | 21 | 9200 | 8150 | 0.9 | 4.5 | 0.2 | 6.5 | 0.3 | 0.85 | -16 | 5.4 | |||||||
|
Québec City Region
|
||||||||||||||||||||||||
|
Ancienne-Lorette
|
35 | -25 | -28 | 28 | 23 | 32 | 26 | 5130 | 4210 | 3.4 | 0.6 | 4.7 | 0.8 | 0.64 | -8 | 4 | ||||||||
|
Lévis
|
50 | -25 | -28 | 28 | 22 | 32 | 25 | 5050 | 4130 | 3.3 | 0.6 | 4.6 | 0.8 | 0.64 | -8 | 4 | ||||||||
|
Québec
|
120 | -25 | -28 | 28 | 22 | 32 | 25 | 5080 | 4160 | 3.6 | 0.6 | 5 | 0.8 | 0.64 | -8 | 3.5 | ||||||||
|
Sainte-Foy
|
115 | -25 | -28 | 28 | 23 | 32 | 26 | 5100 | 4180 | 3.7 | 0.6 | 5.1 | 0.8 | 0.64 | -8 | 3.5 | ||||||||
|
Sillery
|
10 | -25 | -28 | 28 | 23 | 32 | 26 | 5070 | 4150 | 3.1 | 0.6 | 4.2 | 0.8 | 0.64 | -8 | 3.5 | ||||||||
|
Richmond
|
150 | -25 | -27 | 29 | 22 | 33 | 25 | 4700 | 3860 | 160 | 2.4 | 0.6 | 3.5 | 0.9 | 0.5 | -9 | 3.5 | |||||||
|
Rimouski
|
30 | -25 | -27 | 26 | 20 | 30 | 23 | 5300 | 4370 | 3.8 | 0.4 | 5.5 | 0.6 | 0.77 | -8 | 5 | ||||||||
|
Rivière-du-Loup
|
55 | -25 | -27 | 26 | 21 | 30 | 24 | 5380 | 4450 | 3.5 | 0.6 | 5 | 0.9 | 0.75 | -8 | 4 | ||||||||
|
Roberval
|
100 | -31 | -33 | 28 | 21 | 32 | 24 | 5750 | 4810 | 0.8 | 3.5 | 0.3 | 5 | 0.4 | 0.53 | -11 | 3.8 | |||||||
|
Rock Island
|
160 | -25 | -27 | 29 | 23 | 33 | 26 | 4850 | 3990 | 160 | 2 | 0.4 | 2.9 | 0.6 | 0.55 | -8 | 3 | |||||||
|
Rosemère
|
25 | -24 | -26 | 29 | 23 | 33 | 26 | 4550 | 3720 | 2.6 | 0.4 | 3.8 | 0.6 | 0.64 | -8 | 3.3 | ||||||||
|
Rouyn
|
300 | -33 | -36 | 29 | 21 | 33 | 24 | 6050 | 5100 | 0.8 | 3.1 | 0.3 | 4.2 | 0.4 | 0.53 | -11 | 3.5 | |||||||
|
Saguenay
|
10 | -30 | -32 | 28 | 22 | 32 | 25 | 5700 | 4760 | 2.7 | 0.4 | 3.7 | 0.6 | 0.54 | -10 | 4.2 | ||||||||
|
Saguenay (Bagotville)
|
5 | -31 | -33 | 28 | 21 | 32 | 24 | 5700 | 4760 | 2.7 | 0.4 | 3.7 | 0.6 | 0.56 | -10 | 4.2 | ||||||||
|
Saguenay (Jonquière)
|
135 | -30 | -32 | 28 | 22 | 32 | 25 | 5650 | 4710 | 3.1 | 0.4 | 4.2 | 0.5 | 0.53 | -10 | 4.2 | ||||||||
|
Saguenay (Kénogami)
|
140 | -30 | -32 | 28 | 22 | 32 | 25 | 5650 | 4710 | 3.1 | 0.4 | 4.2 | 0.5 | 0.53 | -10 | 4.2 | ||||||||
|
Sainte-Agathe-des-Monts
|
360 | -28 | -30 | 28 | 22 | 32 | 25 | 5390 | 4470 | 140 | 3.4 | 0.4 | 4.6 | 0.6 | 0.55 | -9 | 2.2 | |||||||
|
Saint-Eustache
|
35 | -25 | -27 | 29 | 23 | 33 | 26 | 4500 | 3680 | 2.4 | 0.4 | 3.5 | 0.6 | 0.58 | -8 | 3.3 | ||||||||
|
Saint-Félicien
|
105 | -32 | -34 | 28 | 22 | 32 | 25 | 5850 | 4900 | 0.8 | 3.5 | 0.3 | 4.9 | 0.4 | 0.53 | -11 | 3.8 | |||||||
|
Saint-Georges-de-Cacouna
|
35 | -25 | -27 | 26 | 21 | 30 | 24 | 5400 | 4470 | 3.2 | 0.6 | 4.6 | 0.9 | 0.75 | -8 | 4 | ||||||||
|
Saint-Hubert
|
25 | -24 | -26 | 30 | 23 | 34 | 26 | 4490 | 3670 | 2.5 | 0.4 | 3.7 | 0.6 | 0.69 | -8 | 4.6 | ||||||||
|
Saint-Hubert-de-Rivière-du-Loup
|
310 | -26 | -28 | 26 | 21 | 30 | 24 | 5520 | 4590 | 4.4 | 0.6 | 6.3 | 0.9 | 0.61 | -8 | 3 | ||||||||
|
Saint-Hyacinthe
|
35 | -24 | -27 | 30 | 23 | 34 | 26 | 4500 | 3680 | 160 | 2.3 | 0.4 | 3.3 | 0.6 | 0.55 | -8 | 3.5 | |||||||
|
Saint-Jean-sur-Richelieu
|
35 | -24 | -26 | 29 | 23 | 33 | 26 | 4450 | 3630 | 180 | 2.2 | 0.4 | 3.3 | 0.6 | 0.64 | -8 | 3 | |||||||
|
Saint-Jérôme
|
95 | -26 | -28 | 29 | 23 | 33 | 26 | 4820 | 3960 | 2.7 | 0.4 | 3.9 | 0.6 | 0.58 | -8 | 2.5 | ||||||||
|
Saint-Jovite
|
230 | -29 | -31 | 28 | 22 | 32 | 25 | 5250 | 4340 | 160 | 2.8 | 0.4 | 3.8 | 0.5 | 0.51 | -9 | 2.2 | |||||||
|
Saint-Lazare / Hudson
|
60 | -24 | -26 | 30 | 23 | 34 | 26 | 4520 | 3700 | 2.3 | 0.4 | 3.4 | 0.6 | 0.65 | -8 | 3 | ||||||||
|
Saint-Nicolas
|
65 | -25 | -28 | 28 | 22 | 32 | 25 | 4990 | 4070 | 3.5 | 0.6 | 4.9 | 0.8 | 0.65 | -9 | 4 | ||||||||
|
Salaberry-de-Valleyfield
|
50 | -23 | -25 | 29 | 23 | 33 | 26 | 4400 | 3590 | 180 | 2.3 | 0.4 | 3.4 | 0.6 | 0.65 | -8 | 3.1 | |||||||
|
Schefferville
|
550 | -37 | -39 | 24 | 16 | 28 | 20 | 8550 | 7520 | 0.8 | 4.5 | 0.3 | 6.4 | 0.4 | 0.59 | -15 | 4.2 | |||||||
|
Senneterre
|
310 | -34 | -36 | 29 | 21 | 33 | 24 | 6180 | 5220 | 0.9 | 3.3 | 0.3 | 4.6 | 0.4 | 0.47 | -11 | 3.8 | |||||||
|
Sept-Îles
|
5 | -29 | -31 | 24 | 18 | 28 | 22 | 6200 | 5240 | 4.1 | 0.4 | 6 | 0.6 | 0.8 | -9 | 3.9 | ||||||||
|
Shawinigan
|
60 | -26 | -29 | 29 | 23 | 33 | 26 | 5050 | 4130 | 3.1 | 0.4 | 4.3 | 0.6 | 0.55 | -9 | 2.2 | ||||||||
|
Shawville
|
170 | -27 | -30 | 30 | 23 | 34 | 26 | 4880 | 3970 | 160 | 2.8 | 0.4 | 4 | 0.6 | 0.55 | -8 | 2.8 | |||||||
|
Sherbrooke
|
185 | -28 | -30 | 29 | 23 | 33 | 26 | 4700 | 3790 | 160 | 2.2 | 0.6 | 3.2 | 0.9 | 0.5 | -8 | 3.1 | |||||||
|
Sorel
|
10 | -25 | -27 | 29 | 23 | 33 | 26 | 4550 | 3720 | 2.8 | 0.4 | 4.1 | 0.6 | 0.66 | -8 | 3.5 | ||||||||
|
Sutton
|
185 | -25 | -27 | 29 | 23 | 33 | 26 | 4600 | 3770 | 160 | 2.4 | 0.4 | 3.5 | 0.6 | 0.58 | -8 | 2.8 | |||||||
|
Tadoussac
|
65 | -26 | -28 | 27 | 21 | 31 | 24 | 5450 | 4520 | 3.7 | 0.4 | 5.3 | 0.6 | 0.77 | -10 | 6.9 | ||||||||
|
Témiscaming
|
240 | -30 | -32 | 30 | 22 | 34 | 25 | 5020 | 4100 | 0.9 | 100 | 2.5 | 0.4 | 3.3 | 0.5 | 0.5 | -9 | 2.7 | ||||||
|
Terrebonne
|
20 | -25 | -27 | 29 | 23 | 33 | 26 | 4500 | 3680 | 2.6 | 0.4 | 3.8 | 0.6 | 0.64 | -8 | 3.5 | ||||||||
|
Thetford Mines
|
330 | -26 | -28 | 28 | 22 | 32 | 25 | 5120 | 4200 | 160 | 3.5 | 0.6 | 5 | 0.9 | 0.55 | -9 | 3.2 | |||||||
|
Thurso
|
50 | -26 | -28 | 30 | 23 | 34 | 26 | 4820 | 3910 | 160 | 2.4 | 0.4 | 3.3 | 0.6 | 0.64 | -8 | 2.5 | |||||||
|
Trois-Rivières
|
25 | -25 | -28 | 29 | 23 | 33 | 26 | 4900 | 3980 | 2.8 | 0.4 | 4 | 0.6 | 0.66 | -9 | 3.1 | ||||||||
|
Val-des-Sources
|
245 | -26 | -28 | 29 | 22 | 33 | 25 | 4800 | 3890 | 160 | 2.8 | 0.6 | 4.1 | 0.9 | 0.55 | -9 | 3.4 | |||||||
|
Val-d'Or
|
310 | -33 | -36 | 29 | 21 | 33 | 24 | 6180 | 5220 | 0.8 | 3.4 | 0.3 | 4.7 | 0.4 | 0.47 | -11 | 3.8 | |||||||
|
Varennes
|
15 | -24 | -26 | 30 | 23 | 34 | 26 | 4500 | 3680 | 2.6 | 0.4 | 3.8 | 0.6 | 0.64 | -8 | 3.8 | ||||||||
|
Verchères
|
15 | -24 | -26 | 30 | 23 | 34 | 26 | 4450 | 3630 | 2.7 | 0.4 | 3.9 | 0.6 | 0.66 | -8 | 3.8 | ||||||||
|
Victoriaville
|
125 | -26 | -28 | 29 | 23 | 33 | 26 | 4900 | 3980 | 180 | 2.6 | 0.6 | 3.8 | 0.9 | 0.55 | -9 | 3.5 | |||||||
|
Ville-Marie
|
200 | -31 | -34 | 30 | 22 | 34 | 25 | 5550 | 4610 | 0.8 | 2.3 | 0.4 | 3.1 | 0.6 | 0.64 | -11 | 4.2 | |||||||
|
Wakefield
|
120 | -27 | -30 | 30 | 23 | 34 | 26 | 4820 | 3910 | 160 | 2.4 | 0.4 | 3.5 | 0.6 | 0.52 | -8 | 2.2 | |||||||
|
Waterloo
|
205 | -25 | -27 | 29 | 23 | 33 | 26 | 4650 | 3810 | 160 | 2.5 | 0.4 | 3.6 | 0.6 | 0.55 | -8 | 3 | |||||||
|
Windsor
|
150 | -25 | -27 | 29 | 23 | 33 | 26 | 4700 | 3860 | 160 | 2.3 | 0.4 | 3.4 | 0.6 | 0.5 | -8 | 3.5 | |||||||
| New Brunswick | ||||||||||||||||||||||||
|
Alma
|
5 | -21 | -23 | 26 | 20 | 29 | 23 | 4500 | 3600 | 2.6 | 0.6 | 3.9 | 0.9 | 0.76 | -7 | 4.5 | ||||||||
|
Bathurst
|
10 | -23 | -26 | 30 | 22 | 34 | 25 | 5020 | 4100 | 4.1 | 0.6 | 5.9 | 0.9 | 0.76 | -8 | 4 | ||||||||
|
Boiestown
|
65 | -25 | -28 | 29 | 21 | 33 | 24 | 4900 | – | 3.6 | 0.6 | 5.1 | 0.9 | 0.62 | -8 | 2.8 | ||||||||
|
Campbellton
|
30 | -26 | -28 | 29 | 22 | 33 | 25 | 5500 | 4570 | 4.3 | 0.4 | 6 | 0.6 | 0.7 | -8 | 4.1 | ||||||||
|
Edmundston
|
160 | -27 | -29 | 28 | 22 | 32 | 25 | 5320 | 4500 | 3.4 | 0.6 | 4.8 | 0.9 | 0.59 | -9 | 2 | ||||||||
|
Fredericton
|
15 | -24 | -27 | 29 | 22 | 33 | 25 | 4670 | 3760 | 3.1 | 0.6 | 4.5 | 0.9 | 0.59 | -7 | 3.5 | ||||||||
|
Gagetown
|
20 | -24 | -26 | 29 | 22 | 32 | 25 | 4460 | 3560 | 2.8 | 0.6 | 4.1 | 0.9 | 0.64 | -7 | 3.5 | ||||||||
|
Grand Falls
|
115 | -27 | -30 | 28 | 22 | 32 | 25 | 5300 | 4450 | 3.6 | 0.6 | 5.1 | 0.8 | 0.59 | -8 | 2.2 | ||||||||
|
Miramichi
|
5 | -24 | -26 | 30 | 22 | 34 | 25 | 4950 | 4030 | 3.4 | 0.6 | 4.8 | 0.9 | 0.64 | -7 | 3.2 | ||||||||
|
Moncton
|
20 | -23 | -25 | 28 | 21 | 31 | 24 | 4680 | 3770 | 3 | 0.6 | 4.3 | 0.9 | 0.79 | -7 | 5.2 | ||||||||
|
Oromocto
|
20 | -24 | -26 | 29 | 22 | 33 | 25 | 4650 | 3740 | 3 | 0.6 | 4.4 | 0.9 | 0.62 | -7 | 3.5 | ||||||||
|
Sackville
|
15 | -22 | -24 | 27 | 21 | 30 | 24 | 4590 | 3680 | 2.5 | 0.6 | 3.7 | 0.9 | 0.77 | -7 | 4.5 | ||||||||
|
Saint Andrews
|
35 | -22 | -24 | 25 | 20 | 28 | 23 | 4680 | 3770 | 2.8 | 0.6 | 4.1 | 0.9 | 0.7 | -7 | 4.5 | ||||||||
|
Saint John
|
5 | -22 | -24 | 25 | 20 | 28 | 23 | 4570 | 3670 | 2.3 | 0.6 | 3.4 | 0.9 | 0.83 | -7 | 4.5 | ||||||||
|
Shippagan
|
5 | -22 | -24 | 28 | 21 | 32 | 24 | 4930 | 4010 | 3.4 | 0.6 | 4.7 | 0.8 | 0.99 | -7 | 4.8 | ||||||||
|
St. George
|
35 | -21 | -23 | 25 | 20 | 28 | 23 | 4680 | 3770 | 2.8 | 0.6 | 4.2 | 0.9 | 0.7 | -7 | 4.5 | ||||||||
|
St. Stephen
|
20 | -24 | -26 | 28 | 22 | 31 | 25 | 4700 | 3790 | 2.9 | 0.6 | 4.2 | 0.9 | 0.65 | -7 | 4 | ||||||||
|
Woodstock
|
60 | -26 | -29 | 30 | 22 | 34 | 25 | 4910 | 3990 | 3.1 | 0.6 | 4.4 | 0.9 | 0.58 | -8 | 2.4 | ||||||||
| Nova Scotia | ||||||||||||||||||||||||
|
Amherst
|
25 | -21 | -24 | 27 | 21 | 31 | 24 | 4500 | 3600 | 2.4 | 0.6 | 3.5 | 0.9 | 0.76 | -6 | 4.3 | ||||||||
|
Antigonish
|
10 | -17 | -20 | 27 | 21 | 31 | 24 | 4510 | 3610 | 2.3 | 0.6 | 3.5 | 0.9 | 0.84 | -5 | 4.6 | ||||||||
|
Bridgewater
|
10 | -15 | -17 | 27 | 20 | 30 | 23 | 4140 | 3250 | 1.9 | 0.6 | 2.9 | 0.9 | 0.85 | -5 | 4 | ||||||||
|
Canso
|
5 | -13 | -15 | 25 | 20 | 29 | 23 | 4400 | 3500 | 260 | 1.7 | 0.6 | 2.5 | 0.9 | 0.95 | -4 | 7.5 | |||||||
|
Debert
|
45 | -21 | -24 | 27 | 21 | 31 | 24 | 4500 | 3600 | 2.1 | 0.6 | 3.1 | 0.9 | 0.76 | -6 | 3.8 | ||||||||
|
Digby
|
35 | -15 | -17 | 25 | 20 | 28 | 23 | 4020 | 3130 | 2.2 | 0.6 | 3.2 | 0.9 | 0.85 | -4 | 5 | ||||||||
|
Greenwood (CFB)
|
28 | -18 | -20 | 29 | 22 | 32 | 25 | 4140 | 3250 | 2.7 | 0.6 | 4 | 0.9 | 0.84 | -5 | 4.2 | ||||||||
|
Halifax Region
|
||||||||||||||||||||||||
|
Dartmouth
|
10 | -16 | -18 | 26 | 20 | 29 | 23 | 4100 | 3210 | 1.6 | 0.6 | 2.4 | 0.9 | 0.91 | -5 | 3.9 | ||||||||
|
Halifax
|
55 | -16 | -18 | 26 | 20 | 29 | 23 | 4000 | 3110 | 1.9 | 0.6 | 2.8 | 0.9 | 0.91 | -5 | 3.9 | ||||||||
|
Kentville
|
25 | -18 | -20 | 28 | 21 | 31 | 24 | 4130 | 3240 | 2.6 | 0.6 | 3.9 | 0.9 | 0.84 | -5 | 3.2 | ||||||||
|
Liverpool
|
20 | -16 | -18 | 27 | 20 | 30 | 23 | 3990 | 3100 | 1.7 | 0.6 | 2.5 | 0.9 | 0.95 | -5 | 4.1 | ||||||||
|
Lockeport
|
5 | -14 | -16 | 25 | 20 | 28 | 23 | 4000 | 3110 | 1.4 | 0.6 | 2.1 | 0.9 | 0.94 | -4 | 5.5 | ||||||||
|
Louisbourg
|
5 | -15 | -17 | 26 | 20 | 30 | 23 | 4530 | 3630 | 300 | 2.1 | 0.7 | 3.2 | 1.1 | 1 | -5 | 6 | |||||||
|
Lunenburg
|
25 | -15 | -17 | 26 | 20 | 29 | 23 | 4140 | 3250 | 1.9 | 0.6 | 2.8 | 0.9 | 0.95 | -5 | 4.1 | ||||||||
|
New Glasgow
|
30 | -19 | -21 | 27 | 21 | 31 | 24 | 4320 | 3420 | 2.2 | 0.6 | 3.2 | 0.9 | 0.85 | -6 | 4.6 | ||||||||
|
North Sydney
|
20 | -16 | -19 | 27 | 21 | 31 | 24 | 4500 | 3600 | 300 | 2.4 | 0.6 | 3.6 | 0.9 | 0.92 | -5 | 5.6 | |||||||
|
Pictou
|
25 | -19 | -21 | 27 | 21 | 31 | 24 | 4310 | 3410 | 2.2 | 0.6 | 3.3 | 0.9 | 0.85 | -6 | 4.6 | ||||||||
|
Port Hawkesbury
|
40 | -17 | -19 | 27 | 21 | 31 | 24 | 4500 | 3600 | 260 | 2.1 | 0.6 | 3.2 | 0.9 | 0.95 | -5 | 4.9 | |||||||
|
Springhill
|
185 | -20 | -23 | 27 | 21 | 31 | 24 | 4540 | 3640 | 3.1 | 0.6 | 4.6 | 0.9 | 0.76 | -6 | 4 | ||||||||
|
Stewiacke
|
25 | -20 | -22 | 27 | 21 | 30 | 24 | 4400 | 3500 | 1.8 | 0.6 | 2.7 | 0.9 | 0.79 | -6 | 4.5 | ||||||||
|
Sydney
|
5 | -16 | -19 | 27 | 21 | 31 | 24 | 4530 | 3630 | 300 | 2.3 | 0.6 | 3.5 | 0.9 | 0.92 | -5 | 5.6 | |||||||
|
Tatamagouche
|
25 | -20 | -23 | 27 | 21 | 31 | 24 | 4380 | 3480 | 2.2 | 0.6 | 3.3 | 0.9 | 0.85 | -6 | 4.6 | ||||||||
|
Truro
|
25 | -20 | -22 | 27 | 21 | 30 | 24 | 4500 | 3600 | 2 | 0.6 | 2.9 | 0.9 | 0.76 | -6 | 3.5 | ||||||||
|
Wolfville
|
35 | -19 | -21 | 28 | 21 | 31 | 24 | 4140 | 3250 | 2.6 | 0.6 | 3.9 | 0.9 | 0.84 | -5 | 3.2 | ||||||||
|
Yarmouth
|
10 | -14 | -16 | 22 | 19 | 25 | 22 | 3990 | 3100 | 1.8 | 0.6 | 2.7 | 0.9 | 0.87 | -4 | 5.2 | ||||||||
| Prince Edward Island | ||||||||||||||||||||||||
|
Charlottetown
|
5 | -20 | -22 | 26 | 21 | 30 | 24 | 4460 | 3650 | 2.7 | 0.6 | 4 | 0.9 | 0.87 | -6 | 5 | ||||||||
|
Souris
|
5 | -19 | -21 | 27 | 21 | 31 | 24 | 4550 | 3650 | 2.7 | 0.6 | 4.1 | 0.9 | 0.91 | -6 | 5 | ||||||||
|
Summerside
|
10 | -20 | -22 | 27 | 21 | 31 | 24 | 4600 | 3690 | 3.1 | 0.6 | 4.6 | 0.9 | 0.94 | -6 | 5.5 | ||||||||
|
Tignish
|
10 | -20 | -22 | 27 | 21 | 31 | 24 | 4770 | 3860 | 3.2 | 0.6 | 4.7 | 0.9 | 1.04 | -5 | 7.5 | ||||||||
| Newfoundland and Labrador | ||||||||||||||||||||||||
|
Argentia
|
15 | -12 | -14 | 21 | 18 | 25 | 22 | 4600 | 3620 | 2.4 | 0.7 | 3.5 | 1 | 1.11 | -4 | 6.5 | ||||||||
|
Bonavista
|
15 | -14 | -16 | 24 | 19 | 28 | 22 | 5000 | 4000 | 3.1 | 0.6 | 4.7 | 0.9 | 1.24 | -4 | 7.5 | ||||||||
|
Buchans
|
255 | -24 | -27 | 27 | 20 | 31 | 24 | 5250 | 4240 | 4.7 | 0.6 | 6.8 | 0.9 | 0.89 | -6 | 5 | ||||||||
|
Cape Harrison
|
5 | -29 | -31 | 26 | 16 | 30 | 20 | 6900 | 5920 | 6.3 | 0.4 | 9.3 | 0.6 | 0.89 | -9 | 6 | ||||||||
|
Cape Race
|
5 | -11 | -13 | 19 | 18 | 23 | 22 | 4900 | 3900 | 400 | 2.3 | 0.7 | 3.4 | 1 | 1.56 | -4 | 7.5 | |||||||
|
Channel-Port aux Basques
|
5 | -13 | -15 | 19 | 18 | 23 | 22 | 5000 | 4000 | 3.6 | 0.7 | 5.5 | 1.1 | 1.16 | -4 | 8.3 | ||||||||
|
Corner Brook
|
35 | -16 | -18 | 26 | 20 | 30 | 23 | 4760 | 3770 | 3.7 | 0.6 | 5.3 | 0.9 | 0.81 | -6 | 5 | ||||||||
|
Gander
|
125 | -18 | -20 | 27 | 20 | 31 | 24 | 5110 | 4110 | 3.7 | 0.6 | 5.4 | 0.9 | 0.89 | -5 | 6.3 | ||||||||
|
Grand Bank
|
5 | -14 | -15 | 20 | 18 | 24 | 22 | 4550 | 3570 | 2.4 | 0.7 | 3.6 | 1 | 1.1 | -4 | 6.5 | ||||||||
|
Grand Falls
|
60 | -26 | -29 | 27 | 20 | 31 | 24 | 5020 | 4020 | 3.4 | 0.6 | 4.9 | 0.9 | 0.89 | -6 | 5.5 | ||||||||
|
Happy Valley-Goose Bay
|
15 | -31 | -32 | 27 | 19 | 31 | 23 | 6670 | 5700 | 5.3 | 0.4 | 7.7 | 0.6 | 0.62 | -11 | 4.7 | ||||||||
|
Labrador City
|
550 | -36 | -38 | 24 | 17 | 28 | 20 | 7710 | 6710 | 4.8 | 0.3 | 6.8 | 0.4 | 0.61 | -14 | 4 | ||||||||
|
St. Anthony
|
10 | -25 | -27 | 22 | 18 | 26 | 22 | 6440 | 5380 | 6.1 | 0.6 | 8.9 | 0.9 | 1.3 | -8 | 7.5 | ||||||||
|
Stephenville
|
25 | -16 | -18 | 24 | 19 | 28 | 23 | 4850 | 3860 | 4.1 | 0.6 | 6.1 | 0.9 | 0.87 | -5 | 6.1 | ||||||||
|
St. John's
|
65 | -15 | -16 | 24 | 20 | 28 | 23 | 4800 | 3810 | 2.9 | 0.7 | 4.4 | 1.1 | 1.16 | -4 | 7.5 | ||||||||
|
Twin Falls
|
425 | -35 | -37 | 24 | 17 | 28 | 21 | 7790 | 6880 | 4.8 | 0.4 | 6.8 | 0.6 | 0.61 | -14 | 4 | ||||||||
|
Wabana
|
75 | -15 | -17 | 24 | 20 | 27 | 23 | 4750 | 3760 | 3 | 0.7 | 4.6 | 1.1 | 1.11 | -4 | 4.8 | ||||||||
|
Wabush
|
550 | -36 | -38 | 24 | 17 | 28 | 20 | 7710 | 6710 | 4.8 | 0.3 | 6.8 | 0.4 | 0.61 | -14 | 4 | ||||||||
| Yukon | ||||||||||||||||||||||||
|
Aishihik
|
920 | -44 | -46 | 23 | 15 | 27 | 19 | 7500 | 6500 | 0.6 | 0.1 | 3 | 0.2 | 0.6 | -14 | 2.2 | ||||||||
|
Dawson
|
330 | -50 | -51 | 26 | 16 | 30 | 19 | 8120 | 7100 | 0.6 | 0.1 | 4.4 | 0.2 | 0.48 | -17 | 2 | ||||||||
|
Destruction Bay
|
815 | -43 | -45 | 23 | 14 | 27 | 18 | 7800 | 6790 | 0.6 | 0.1 | 3 | 0.2 | 0.96 | -14 | 2.3 | ||||||||
|
Faro
|
670 | -46 | -47 | 25 | 16 | 29 | 20 | 7300 | 6310 | 0.6 | 0.1 | 3.6 | 0.2 | 0.55 | -14 | 2.3 | ||||||||
|
Haines Junction
|
600 | -45 | -47 | 24 | 14 | 29 | 18 | 7100 | 6120 | 0.6 | 0.1 | 3.3 | 0.2 | 0.54 | -11 | 2.5 | ||||||||
|
Snag
|
595 | -51 | -53 | 23 | 16 | 27 | 19 | 8300 | 7280 | 0.6 | 0.1 | 3.4 | 0.2 | 0.48 | -17 | 2.2 | ||||||||
|
Teslin
|
690 | -42 | -44 | 24 | 15 | 28 | 19 | 6770 | 5800 | 0.5 | 0.1 | 4.6 | 0.2 | 0.49 | -12 | 2.2 | ||||||||
|
Watson Lake
|
685 | -46 | -48 | 26 | 16 | 30 | 20 | 7470 | 6470 | 0.6 | 0.1 | 4.9 | 0.2 | 0.55 | -15 | 2 | ||||||||
|
Whitehorse
|
655 | -41 | -43 | 25 | 15 | 30 | 19 | 6580 | 5610 | 0.5 | 0.1 | 3.2 | 0.2 | 0.56 | -11 | 3.7 | ||||||||
| Northwest Territories | ||||||||||||||||||||||||
|
Aklavik
|
5 | -42 | -44 | 26 | 17 | 29 | 20 | 9600 | 8540 | 0.7 | 0.1 | 4.3 | 0.2 | 0.58 | -17 | 2.9 | ||||||||
|
Behchokǫ̀ / Rae-Edzo
|
160 | -42 | -44 | 25 | 17 | 28 | 20 | 8300 | 7280 | 0.6 | 0.1 | 3.5 | 0.2 | 0.58 | -17 | 3.5 | ||||||||
|
Echo Bay / Port Radium
|
195 | -42 | -44 | 22 | 16 | 25 | 19 | 9300 | 8250 | 0.7 | 0.1 | 4.7 | 0.2 | 0.79 | -17 | 4.4 | ||||||||
|
Fort Good Hope
|
100 | -43 | -45 | 28 | 18 | 31 | 21 | 8700 | 7660 | 0.6 | 0.1 | 4.6 | 0.2 | 0.63 | -17 | 2.8 | ||||||||
|
Fort McPherson
|
25 | -44 | -46 | 26 | 17 | 29 | 20 | 9150 | 8100 | 0.7 | 0.1 | 5 | 0.2 | 0.61 | -17 | 2.3 | ||||||||
|
Fort Providence
|
150 | -40 | -43 | 28 | 18 | 32 | 21 | 7620 | 6620 | 0.6 | 0.1 | 3.6 | 0.2 | 0.53 | -16 | 3 | ||||||||
|
Fort Resolution
|
160 | -40 | -42 | 26 | 18 | 30 | 21 | 7750 | 6740 | 0.6 | 0.1 | 3.5 | 0.2 | 0.6 | -16 | 3.3 | ||||||||
|
Fort Simpson
|
120 | -42 | -44 | 28 | 19 | 31 | 22 | 7660 | 6660 | 0.6 | 80 | 0.1 | 3.3 | 0.1 | 0.6 | -16 | 2.4 | |||||||
|
Fort Smith
|
205 | -41 | -43 | 28 | 19 | 32 | 22 | 7300 | 6310 | 0.6 | 0.2 | 3.5 | 0.3 | 0.6 | -15 | 2.7 | ||||||||
|
Hay River
|
45 | -38 | -41 | 27 | 18 | 31 | 21 | 7550 | 6550 | 0.6 | 0.1 | 3.7 | 0.2 | 0.5 | -16 | 3.3 | ||||||||
|
Inuvik
|
45 | -43 | -45 | 26 | 17 | 30 | 20 | 9600 | 8540 | 0.7 | 0.1 | 4.9 | 0.2 | 0.58 | -16 | 2.6 | ||||||||
|
Mould Bay
|
5 | -44 | -46 | 11 | 8 | 15 | 12 | 12900 | 11730 | 0.9 | 0.1 | 2.3 | 0.2 | 0.87 | -20 | 4.3 | ||||||||
|
Norman Wells
|
65 | -43 | -45 | 28 | 18 | 31 | 21 | 8510 | 7480 | 0.6 | 80 | 0.1 | 4.9 | 0.2 | 0.63 | -17 | 3.1 | |||||||
|
Tungsten
|
1340 | -49 | -51 | 26 | 16 | 30 | 20 | 7700 | 6700 | 0.8 | 0.1 | 6.7 | 0.2 | 0.66 | -16 | 3 | ||||||||
|
Ulukhaktok / Holman
|
10 | -39 | -41 | 18 | 12 | 23 | 16 | 10700 | 9600 | 0.9 | 0.1 | 3.3 | 0.2 | 1.23 | -18 | 4.9 | ||||||||
|
Wrigley
|
80 | -42 | -44 | 28 | 18 | 31 | 21 | 8050 | 7040 | 0.6 | 80 | 0.1 | 4.3 | 0.2 | 0.6 | -16 | 3 | |||||||
|
Yellowknife
|
160 | -41 | -44 | 25 | 17 | 29 | 20 | 8170 | 7150 | 0.6 | 0.1 | 3.4 | 0.2 | 0.58 | -17 | 3.8 | ||||||||
| Nunavut | ||||||||||||||||||||||||
|
Alert
|
5 | -43 | -44 | 13 | 8 | 18 | 12 | 13030 | 11860 | 1 | 0.1 | 4 | 0.2 | 1.06 | -22 | 4.3 | ||||||||
|
Arctic Bay
|
15 | -42 | -44 | 14 | 10 | 19 | 14 | 11900 | 10760 | 0.9 | 0.1 | 3.9 | 0.2 | 0.78 | -20 | 4 | ||||||||
|
Arviat
|
5 | -40 | -41 | 22 | 16 | 27 | 20 | 9850 | 8780 | 0.9 | 0.2 | 4.9 | 0.3 | 0.83 | -19 | 6.6 | ||||||||
|
Baker Lake
|
5 | -42 | -44 | 23 | 15 | 28 | 19 | 10700 | 9600 | 0.8 | 0.2 | 5.5 | 0.3 | 0.77 | -20 | 6.5 | ||||||||
|
Eureka
|
5 | -47 | -48 | 12 | 8 | 17 | 12 | 13500 | 12310 | 1 | 0.1 | 2.5 | 0.2 | 0.78 | -21 | 4.3 | ||||||||
|
Igluligaarjuk / Chesterfield Inlet
|
10 | -40 | -41 | 20 | 14 | 25 | 18 | 10500 | 9410 | 0.9 | 0.2 | 6 | 0.3 | 0.79 | -19 | 6.7 | ||||||||
|
Iqaluit
|
45 | -40 | -41 | 17 | 12 | 21 | 16 | 9980 | 8900 | 0.9 | 0.2 | 4.7 | 0.3 | 0.91 | -16 | 4.8 | ||||||||
|
Iqaluktuuttiaq / Cambridge Bay
|
15 | -41 | -44 | 18 | 13 | 23 | 17 | 11670 | 10540 | 0.9 | 0.1 | 3 | 0.2 | 0.71 | -21 | 5 | ||||||||
|
Isachsen
|
10 | -46 | -48 | 12 | 9 | 17 | 13 | 13600 | 12410 | 1 | 0.1 | 3.1 | 0.2 | 0.85 | -20 | 4.3 | ||||||||
|
Kangiqiniq / Rankin Inlet
|
10 | -41 | -42 | 21 | 15 | 26 | 19 | 10500 | 9410 | 0.9 | 0.2 | 4.9 | 0.3 | 0.85 | -19 | 6.7 | ||||||||
|
Kanngiqtugaapik / Clyde River
|
5 | -40 | -42 | 14 | 10 | 19 | 14 | 11300 | 10180 | 0.9 | 0.2 | 6.8 | 0.3 | 0.78 | -17 | 5 | ||||||||
|
Kugluktuk / Coppermine
|
10 | -41 | -43 | 23 | 16 | 27 | 19 | 10300 | 9210 | 0.8 | 0.1 | 5.4 | 0.2 | 0.65 | -19 | 5.1 | ||||||||
|
Nottingham Island
|
30 | -37 | -39 | 16 | 13 | 21 | 17 | 10000 | 8920 | 0.9 | 0.2 | 7.5 | 0.3 | 1.1 | -17 | 7 | ||||||||
|
Resolute
|
25 | -42 | -43 | 11 | 9 | 16 | 13 | 12360 | 11210 | 0.9 | 0.1 | 3.2 | 0.2 | 0.84 | -19 | 6.1 | ||||||||
|
Resolution Island
|
5 | -32 | -34 | 12 | 10 | 16 | 14 | 9000 | 7960 | 0.9 | 0.2 | 9 | 0.3 | 1.74 | -14 | 9.5 | ||||||||
|
Salliq / Coral Harbour
|
15 | -41 | -42 | 20 | 14 | 25 | 18 | 10720 | 9620 | 0.9 | 0.2 | 6.2 | 0.3 | 0.83 | -18 | 5.5 | ||||||||
996 pp., 2007.
Impact analysis
The following summarizes the updates to the climatic design parameters forming part of NBC Table C-2. The revisions are to account for potential future climate change effects expected over the 50-year design life of buildings and building components.
January 2.5% design temperatures (TJan2.5)
This parameter is used for the design of heating systems in buildings. The values of this parameter are projected to increase for all locations in the future as a consequence of climate warming; therefore, the current historical NBC values are deemed appropriate and are recommended to continue to be used for design. Overall, no change to the NBC 2020 design values of this parameter is proposed.
January 1% design temperatures (TJan1)
This parameter is also used for the design of heating systems in buildings. The values of this parameter are projected to increase for all locations in the future as a consequence of climate warming; therefore, the current historical NBC values are considered appropriate and are recommended to continue to be used for design. Overall, no change to the NBC 2020 design values of this parameter is proposed.
July 2.5% dry temperatures (TJuldry2.5)
This parameter is used for the design of cooling and dehumidifying systems in buildings. The projected values indicate an increase for all locations as a consequence of global warming. Therefore, the NBC 2020 values require updating for climate change effects expected over the design life of 50 years (typical). This updating procedure is expected to result in the following changes in value of this parameter:
| Province or Territory | Number of Locations | 2°C < ΔTJuldry2.5 ≤ 3°C | 3°C < ΔTJuldry2.5 ≤ 4°C | 4°C < ΔTJuldry2.5 ≤ 5°C | 5°C < ΔTJuldry2.5 ≤ 6°C | 6°C < ΔTJuldry2.5 ≤ 7°C |
|---|---|---|---|---|---|---|
| Alberta | 55 | 0 | 0 | 7 | 47 | 1 |
| British Columbia | 108 | 0 | 5 | 21 | 80 | 2 |
| Manitoba | 24 | 0 | 2 | 22 | 0 | 0 |
| New Brunswick | 18 | 0 | 18 | 0 | 0 | 0 |
| Newfoundland | 18 | 0 | 17 | 1 | 0 | 0 |
| Nova Scotia | 25 | 0 | 25 | 0 | 0 | 0 |
| Northwest Territories | 17 | 1 | 13 | 3 | 0 | 0 |
| Nunavut | 16 | 0 | 0 | 15 | 1 | 0 |
| Ontario | 230 | 0 | 229 | 1 | 0 | 0 |
| Prince Edward Island | 4 | 0 | 4 | 0 | 0 | 0 |
| Quebec | 125 | 0 | 119 | 4 | 2 | 0 |
| Saskatchewan | 31 | 0 | 0 | 19 | 12 | 0 |
| Yukon | 9 | 0 | 5 | 4 | 0 | 0 |
| Total | 680 | 1 | 437 | 97 | 142 | 3 |
Across the 680 locations in NBC Table C-2, the projected changes in the values of this parameter over the 50-year future timeframe range from 2.8°C to 6.5°C. A large fraction of the locations (438 out of 680) are projected to have future increases of less than or equal to 4°C, 97 locations are projected to have changes on the order of 4-5°C, 142 locations are projected to have changes on the order of 5-6°C, and 3 locations, in Alberta and British Columbia, are projected to have changes greater than 6°C. To minimize the risk of overheating, and depending on the building location, there will likely be a need for cost-effective solutions to implement fenestration shading systems or advanced fenestration and glazing design, enhanced building envelope design, and a review of the air-handing and cooling system design.
Using a July design temperature based on historical observations for the design of mechanical cooling equipment will
- reduce the risk of oversized cooling equipment
- maintain energy efficiency and energy costs for cooling
- minimize equipment short-cycling and maintain service life of equipment
- reduce the risk of excessive indoor humidity levels
July 2.5% wet temperatures (TJulwet2.5)
This parameter is used for the design of cooling and dehumidifying systems in buildings. The values of this parameter are projected to increase at all locations as a consequence of global warming. Accordingly, the NBC 2020 values require updating for climate change effects expected over the design life of typical building cooling and dehumidifying systems (50 years). This updating procedure is expected to result in the following changes in the value of this parameter:
| Province or Territory | Number of Locations | 1°C < ΔTJulwet2.5 ≤ 2°C | 2°C < ΔTJulwet2.5 ≤ 3°C | 3°C < ΔTJulwet2.5 ≤ 4°C | 4°C < ΔTJulwet2.5 ≤ 5°C | 5°C < ΔTJulwet2.5 ≤ 6°C |
|---|---|---|---|---|---|---|
| Alberta | 55 | 0 | 0 | 21 | 34 | 0 |
| British Columbia | 108 | 0 | 0 | 16 | 92 | 0 |
| Manitoba | 24 | 0 | 1 | 23 | 0 | 0 |
| New Brunswick | 18 | 0 | 0 | 18 | 0 | 0 |
| Newfoundland | 18 | 0 | 0 | 18 | 0 | 0 |
| Nova Scotia | 25 | 0 | 5 | 20 | 0 | 0 |
| Northwest Territories | 17 | 0 | 3 | 14 | 0 | 0 |
| Nunavut | 16 | 0 | 0 | 8 | 8 | 0 |
| Ontario | 230 | 0 | 218 | 12 | 0 | 0 |
| Prince Edward Island | 4 | 0 | 0 | 4 | 0 | 0 |
| Quebec | 125 | 0 | 106 | 17 | 2 | 0 |
| Saskatchewan | 31 | 0 | 0 | 27 | 4 | 0 |
| Yukon | 9 | 0 | 0 | 9 | 0 | 0 |
| Total | 680 | 0 | 333 | 207 | 140 | 0 |
Across the 680 locations in NBC Table C-2, the projected changes in the values of this parameter over the 50-year future timeframe range from 2.6°C to 5°C. All locations in Manitoba, New Brunswick, Newfoundland, Nova Scotia, Northwest Territories, Ontario, Prince Edward Island and Yukon are projected to have future increases of less than or equal to 4°C, whereas some locations in Alberta, Nunavut, Quebec and Saskatchewan are projected to have future increases greater than 4°C. To minimize the risk of overheating, there will likely be a need for cost-effective solutions to implement fenestration shading systems or advanced fenestration and glazing design, enhanced building envelope design, and a review of the air-handing and cooling system design.
Using a July design temperature based on historical observations for the design of mechanical cooling equipment will
- reduce the risk of oversized cooling equipment
- maintain energy efficiency and energy costs for cooling
- minimize equipment short-cycling and maintain service life of equipment
- reduce the risk of excessive indoor humidity levels
Degree-days below 18°C (HDD18)
This parameter is used to identify the required levels of insulation in the building. The values of this parameter are projected to decrease for all locations in the future as a consequence of climate change; therefore, the current values are deemed appropriate and are recommended to continued to be used for design. Overall, no change in the NBC 2020 design values of this parameter is proposed.
15-minute rain (Rain15)
This parameter is used for the design roof drainage systems. The values of this parameter are projected to increase at all reference locations as a consequence of climate change. Therefore, the design values require updating for climate change effects expected over the design life of buildings (50 years). This updating procedure is expected to result in the following changes in the value of this parameter:
| Province or Territory | Number of Locations | ΔRain15 ≤ 20% | 20% < ΔRain15 ≤ 30% | 30% < ΔRain15 ≤ 40% | 40% < ΔRain15 ≤ 50% | ΔRain15 > 50% |
|---|---|---|---|---|---|---|
| Alberta | 55 | 0 | 55 | 0 | 0 | 0 |
| British Columbia | 108 | 0 | 104 | 4 | 0 | 0 |
| Manitoba | 24 | 0 | 3 | 20 | 1 | 0 |
| New Brunswick | 18 | 0 | 18 | 0 | 0 | 0 |
| Newfoundland | 18 | 0 | 12 | 6 | 0 | 0 |
| Nova Scotia | 25 | 0 | 25 | 0 | 0 | 0 |
| Northwest Territories | 17 | 0 | 0 | 13 | 3 | 1 |
| Nunavut | 16 | 0 | 0 | 2 | 10 | 4 |
| Ontario | 230 | 0 | 207 | 23 | 0 | 0 |
| Prince Edward Island | 4 | 0 | 4 | 0 | 0 | 0 |
| Quebec | 125 | 0 | 73 | 49 | 3 | 0 |
| Saskatchewan | 31 | 0 | 18 | 13 | 0 | 0 |
| Yukon | 9 | 0 | 5 | 4 | 0 | 0 |
| Total | 680 | 0 | 524 | 134 | 17 | 5 |
Across the 680 locations in NBC Table C-2, the projected changes in the values of this parameter over the 50-year future timeframe range from 21.8% to 56.1%. A large fraction of the locations (524 out of 680) are projected to have future increases of less than or equal to 30%, whereas, 156 locations are projected to have future increases of 30% or more.
Cost impact on roof drainage systems in the NPC
Refer to "Cost Impact on Roof Drainage Systems in NPC" in the supporting document for PCF 1979 for the full cost analysis. A summary is reproduced here.
The cost impact on roof drainage system requirements per Article 2.4.1.4. in the NPC was determined for three archetypal buildings. The cost increase for upsizing the combined primary and emergency roof drainage systems due to the updated 15-minute rainfall values was calculated. This does not account for the impact of the proposed change on alternative acceptable solutions, such as scuppers. The locations impacted and the cost increase for each archetypal building are as follows:
| 2-storey | 10-storey | 20-storey | ||||||||||
|---|---|---|---|---|---|---|---|---|---|---|---|---|
| Locations impacted | Min. cost diff. |
Max. cost diff. | Avg. cost diff. | Locations impacted | Min. cost diff. |
Max. cost diff. | Avg. cost diff. | Locations impacted | Min. cost diff. |
Max. cost diff. | Avg. cost diff. | |
| NUTable footnote (1) | 9 | - | - | - | 13 | - | - | - | 16 | - | - | - |
| NT | 17 | 45 | 743 | 546 | 16 | 55 | 2094 | 1503 | 17 | 45 | 6253 | 3988 |
| YT | 9 | 41 | 680 | 325 | 9 | 673 | 1770 | 1161 | 9 | 41 | 5729 | 2569 |
| BC | 103 | 45 | 741 | 384 | 107 | 55 | 1928 | 986 | 104 | 45 | 6241 | 2686 |
| AB | 42 | 65 | 2000 | 506 | 44 | 65 | 4845 | 1308 | 52 | 65 | 9600 | 2364 |
| SK | 26 | 91 | 1846 | 1319 | 28 | 82 | 5206 | 2780 | 28 | 1283 | 8862 | 5575 |
| MB | 7 | 91 | 1665 | 478 | 18 | 82 | 5184 | 1247 | 9 | 1277 | 8742 | 2632 |
| ON | 181 | 100 | 2029 | 1764 | 229 | 91 | 5722 | 3968 | 181 | 1410 | 9741 | 8711 |
| QC | 109 | 63 | 1953 | 1581 | 112 | 87 | 4732 | 3502 | 122 | 63 | 10733 | 6744 |
| NB | 13 | 90 | 1832 | 1092 | 12 | 82 | 4439 | 1897 | 18 | 1273 | 10070 | 3676 |
| PE | 1 | 55 | 55 | 55 | 4 | 1439 | 1495 | 1453 | 1 | 55 | 55 | 55 |
| NS | 10 | 62 | 94 | 65 | 16 | 1514 | 1670 | 1625 | 17 | 62 | 1327 | 657 |
| NL | 13 | 60 | 688 | 130 | 12 | 151 | 1789 | 1144 | 18 | 60 | 5790 | 787 |
Note to Table:
Footnote 1 Return to table footnote (1) referrer Cost data for Nunavut not available.
One-day rain (Rain1day)
This parameter is used for design for the accumulation of rainwater on roofs. The values of this parameter are projected to increase at all locations as a consequence of climate change. Therefore, the values require updating for climate change effects expected over the design life of buildings (50 years). This updating procedure is expected to result in following changes in the values of this parameter:
| Province or Territory | Number of Locations | ΔRain1day ≤ 20% | 20% < ΔRain1day ≤ 30% | 30% < ΔRain1day ≤ 40% | 40% < ΔRain1day ≤ 50% | ΔRain1day > 50% |
|---|---|---|---|---|---|---|
| Alberta | 55 | 0 | 55 | 0 | 0 | 0 |
| British Columbia | 108 | 0 | 104 | 4 | 0 | 0 |
| Manitoba | 24 | 0 | 3 | 20 | 1 | 0 |
| New Brunswick | 18 | 0 | 18 | 0 | 0 | 0 |
| Newfoundland | 18 | 0 | 12 | 6 | 0 | 0 |
| Nova Scotia | 25 | 0 | 25 | 0 | 0 | 0 |
| Northwest Territories | 17 | 0 | 0 | 13 | 3 | 1 |
| Nunavut | 16 | 0 | 0 | 2 | 10 | 4 |
| Ontario | 230 | 0 | 207 | 23 | 0 | 0 |
| Prince Edward Island | 4 | 0 | 4 | 0 | 0 | 0 |
| Quebec | 125 | 0 | 73 | 49 | 3 | 0 |
| Saskatchewan | 31 | 0 | 18 | 13 | 0 | 0 |
| Yukon | 9 | 0 | 5 | 4 | 0 | 0 |
| Total | 680 | 0 | 524 | 134 | 17 | 5 |
Across the 680 locations in NBC Table C-2, the projected changes in the value of this parameter over the 50-year future timeframe range from 21.8% to 56.1%. A large fraction of the locations (524 out of 680) are projected to have future increases of less than or equal to 30%, whereas 156 locations are projected to have future increases of 30% or more.
To account for the projected increase in the amount of rain that may fall in a day, and thus to avoid water accumulation and ponding on the roof, the design of the drainage systems would be adjusted, as the value of this parameter would affect the drainage design of flat roofs. The design of the drainage system would need to consider both the number of control flow roof drains and scuppers, and their proper sizing. In the future, there will be a need to design roof areas to drain accumulated water that may result from greater rain loads from the roof.
Moisture index (MI)
This parameter is used to define the minimum levels of protection from precipitation to be provided by cladding assemblies on exterior walls. The following is a summary of the projected changes in values of this parameter as a consequence of climate change over a 50-year horizon, which corresponds to the typical design life of buildings (50 years):
| Province or Territory | Number of Locations | ΔMI ≤ -10% | -10% < ΔMI≤ 0 | 0 < ΔMI≤ 10% | 10% < ΔMI≤ 20% | ΔMI > 20% |
|---|---|---|---|---|---|---|
| Alberta | 55 | 5 | 46 | 4 | 0 | 0 |
| British Columbia | 108 | 0 | 11 | 52 | 21 | 24 |
| Manitoba | 24 | 4 | 20 | 0 | 0 | 0 |
| New Brunswick | 18 | 0 | 0 | 5 | 13 | 0 |
| Newfoundland | 18 | 0 | 0 | 5 | 13 | 0 |
| Nova Scotia | 25 | 0 | 0 | 12 | 13 | 0 |
| Northwest Territories | 17 | 0 | 17 | 0 | 0 | 0 |
| Nunavut | 16 | 0 | 13 | 3 | 0 | 0 |
| Ontario | 230 | 0 | 63 | 167 | 0 | 0 |
| Prince Edward Island | 4 | 0 | 0 | 2 | 2 | 0 |
| Quebec | 125 | 0 | 1 | 110 | 14 | 0 |
| Saskatchewan | 31 | 26 | 5 | 0 | 0 | 0 |
| Yukon | 9 | 0 | 7 | 2 | 0 | 0 |
| Total | 680 | 35 | 183 | 362 | 76 | 24 |
Across the 680 locations in NBC Table C-2, the projected changes in the values of this parameter over a 50-year future timeframe range from -19.4% to 29.4%. A large fraction of the locations (545 out of 680) are projected to have changes of up to ±10%. A total of 35 locations, located in the prairie provinces of Alberta, Manitoba and Saskatchewan, are projected to have future decreases of greater than 10%, whereas 24 locations, all located in British Columbia, are projected to have future increases of greater than 20%.
The worst-case MI values are recommended for design. This implies that, for locations where future decreases in MI are projected, the current values of MI are recommended for the design of cladding assemblies on exterior walls, whereas for locations where future increases in MI are projected, the future projected values of MI are recommended for design. Overall, 462 locations are projected to have future increases in MI, and 218 locations are projected to have future decreases. Out of the 462 locations projected to have future increases, only 265 locations are associated with projected changes large enough to not be rounded off within one decimal point (the level of accuracy to which MI values are reported in the NBC). Accordingly, the current MI values are updated to increased future projected MI values for these 265 locations and kept unchanged for other locations.
With these changes in MI design values, a cavity between the cladding and the membrane sheathing will be required at 82 additional locations (shown in Figure 1) to minimize the probability of moisture accumulation inboard of the cladding.
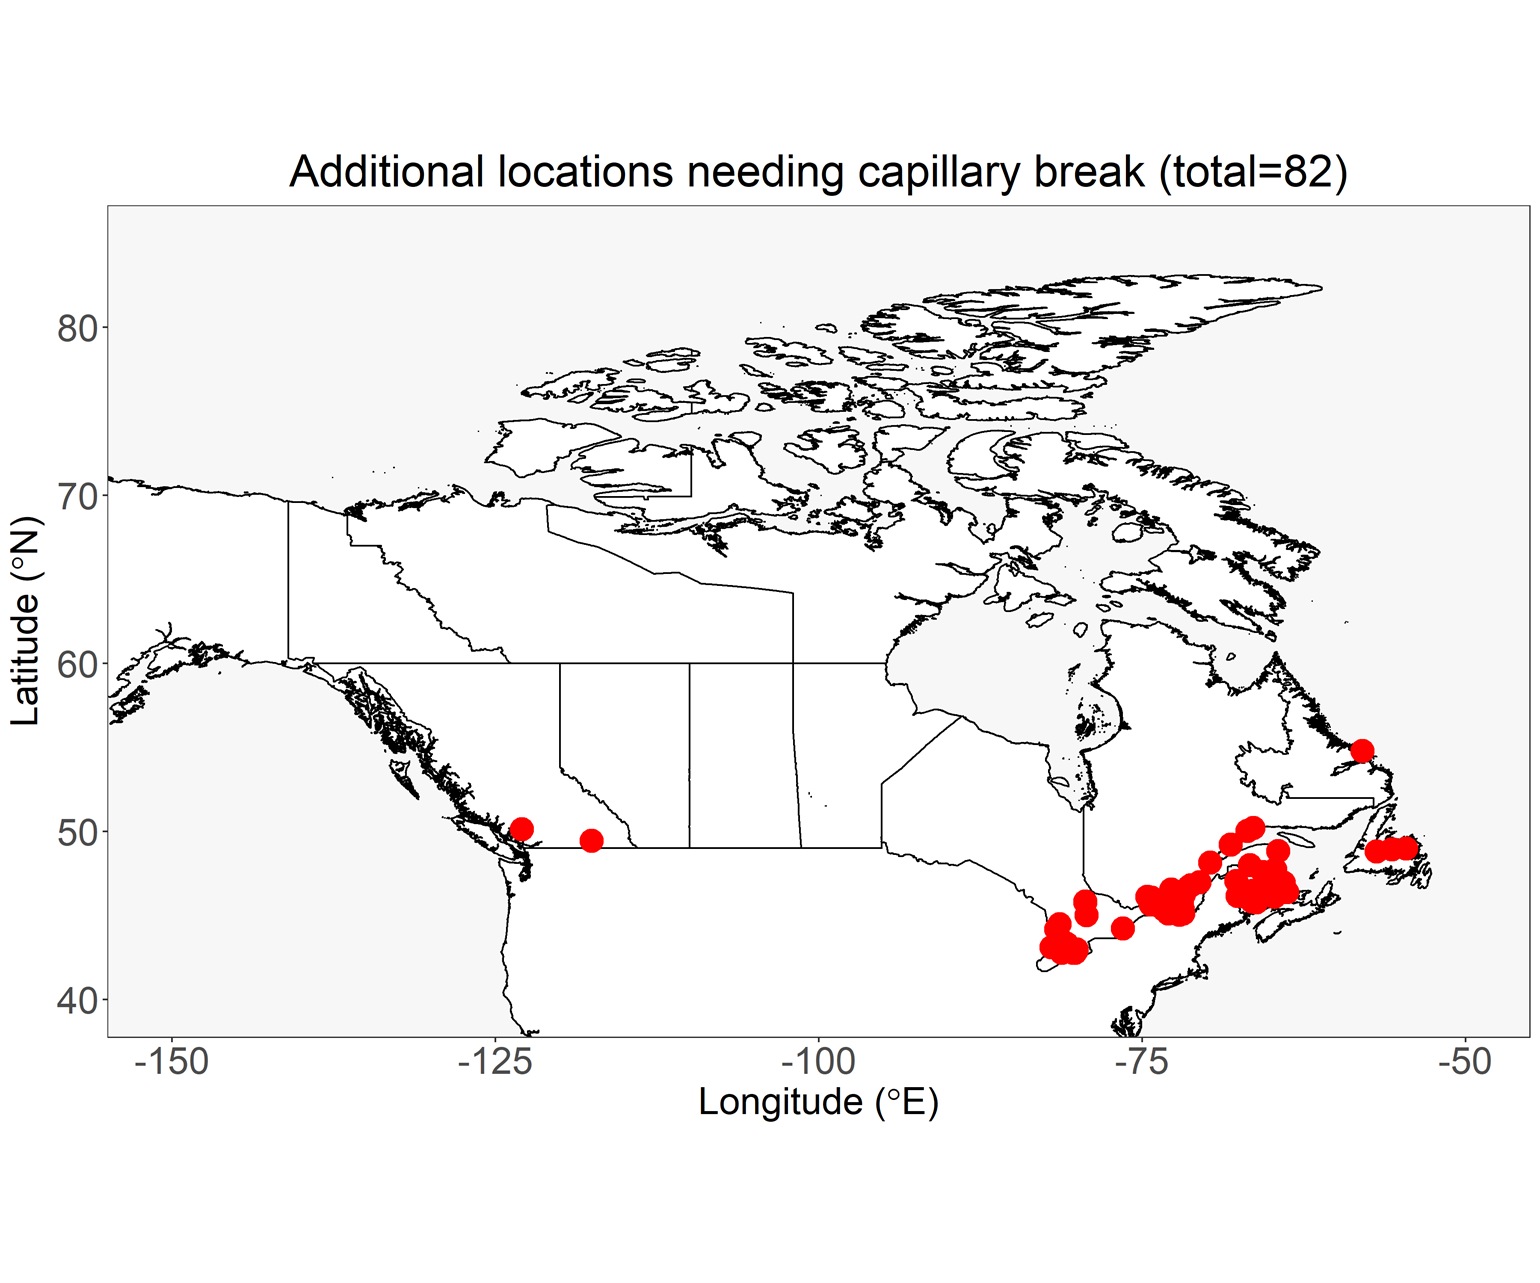
Figure 1. Additional locations in NBC Table C-2 that will require a capillary break for protection from potential moisture damage in the building envelope, taking climate change effects into consideration.
Cost impact on NBC Part 9 of updated moisture index values
Refer to "Cost Impact on Part 9 of Updated Moisture Index Values" in the supporting document for PCF 1979 for the full cost analysis. A summary is reproduced here.
The cost impact with respect to NBC Part 9 requirements for termite and decay protection per NBC 9.3.2.9.(3)(b) was determined for the 56 locations with a moisture index moving from less than or equal to 1 to greater than 1 due to the updated moisture index values. The locations impacted and the cost increases for a sample wood deck using preservative-treated instead of untreated lumber are as follows:
| Northern | BC | AB | Prairies | ON | QC | Atlantic | National | |||||||
|---|---|---|---|---|---|---|---|---|---|---|---|---|---|---|
| NT | NU | YT | SK | MB | NB | PE | NS | NL | ||||||
| Total locations impacted | 0 | 0 | 0 | 4 | 0 | 0 | 0 | 2 | 37 | 8 | 2 | 0 | 3 | 56 |
| Cost difference per deck ($) | n/a | n/a | n/a | 289.20 | n/a | n/a | n/a | 271.91 | 435.24 | 444.62 | 444.62 | n/a | 544.17 | 415.89 |
The cost impact with respect to NBC Part 9 requirements for minimum protection from precipitation ingress per NBC Sentence 9.27.2.2.(5) was determined for the 53 new locations that will require a capillary break between the first and second planes of protection due to the updated moisture index values. The material and installation costs for vertical strapping between the cladding and sheathing to provide a capillary break were calculated for an archetypal house. The locations impacted and the cost increase per unit are as follows:
| Northern | BC | AB | Prairies | ON | QC | Atlantic | National | |||||||
|---|---|---|---|---|---|---|---|---|---|---|---|---|---|---|
| NT | NU | YT | SK | MB | NB | PE | NS | NL | ||||||
| Total locations impacted | 0 | 0 | 0 | 1 | 0 | 0 | 0 | 2 | 37 | 8 | 2 | 0 | 3 | 53 |
| Cost per unit ($) | n/a | n/a | n/a | 1706 | n/a | n/a | n/a | 1666 | 1653 | 1226 | 1226 | n/a | 1520 | 1391 |
Driving rain wind pressure (DRWP)
This parameter is used for the design of wall assemblies to help ensure that incidental water entry into the assembly is minimized and for the selection of fenestration products. The following is a summary of the projected changes in the values of this parameter as a consequence of climate change over the typical design life of buildings (50 years):
| Province or Territory | Number of Locations | ΔDRWP ≤ -5% | -5% < ΔDRWP ≤ 0 | 0 < ΔDRWP ≤ 5% | 5% < ΔDRWP ≤ 10% | ΔDRWP > 10% |
|---|---|---|---|---|---|---|
| Alberta | 55 | 0 | 3 | 23 | 21 | 8 |
| British Columbia | 108 | 0 | 0 | 0 | 42 | 66 |
| Manitoba | 24 | 0 | 4 | 3 | 12 | 5 |
| New Brunswick | 18 | 0 | 0 | 2 | 10 | 6 |
| Newfoundland | 18 | 0 | 0 | 5 | 7 | 6 |
| Nova Scotia | 25 | 0 | 1 | 13 | 10 | 1 |
| Northwest Territories | 17 | 0 | 0 | 2 | 6 | 9 |
| Nunavut | 16 | 0 | 0 | 0 | 2 | 14 |
| Ontario | 230 | 0 | 16 | 35 | 169 | 10 |
| Prince Edward Island | 4 | 0 | 0 | 1 | 1 | 2 |
| Quebec | 125 | 0 | 14 | 43 | 53 | 15 |
| Saskatchewan | 31 | 1 | 5 | 12 | 11 | 2 |
| Yukon | 9 | 0 | 0 | 0 | 0 | 9 |
| Total | 680 | 1 | 43 | 139 | 344 | 153 |
Across the 680 locations in NBC Table C-2, the projected changes in the values of this parameter over a 50-year future timeframe range from -5.4% to 17.8%. A large fraction of the locations (636 out of 680) are projected to have future increases in DRWP, whereas 44 locations are projected to have future decreases. Out of the 636 locations projected to have future increases, 548 locations are projected to have changes large enough to not be rounded off within zero decimal places (the level of accuracy to which DRWP values are reported in the NBC). Accordingly, the current DRWP values are updated to increased future projected values for these 548 locations, for the design of wall assemblies and selection of fenestration products, and the current DRWP values are retained for the other locations. The design to ensure the watertightness of waterproofing systems around windows and doors would also need to account for the change in DRWP at locations where the increase is larger than 10% (i.e., for 153 locations).
Cost impact on NBC Part 9 of updated DRWP values
Refer to "Cost Impact on Part 9 of Updated Driving Rain Wind Pressure (DRWP) values" in the supporting document for PCF 1979 for the full cost analysis. A summary is reproduced here.
The cost impact with respect to NBC Part 9 requirements for flashing installation per NBC Clause 9.27.3.8.(4)(c) was determined for 74 locations where the required end-dam height will be increased due to the updated DRWP values. The cost increase of extending the end-dam height of window flashing was calculated for an archetypal house. The locations impacted and the cost increase per unit are as follows:
| Northern | BC | AB | Prairies | ON | QC | Atlantic | National | |||||||
|---|---|---|---|---|---|---|---|---|---|---|---|---|---|---|
| NT | NU | YT | SK | MB | NB | PE | NS | NL | ||||||
| Total locations impacted |
0 | 4 | 1 | 21 | 0 | 3 | 1 | 0 | 9 | 3 | 4 | 16 | 12 | 74 |
| Total cost of extra flashing per unit ($) |
n/a | Table footnote (1) | 4.09 | 4.96 | n/a | 1.43 | 1.36 | n/a | 2.86 | 2.04 | 2.67 | 1.42 | 3.54 | 1.88 |
Note to Table:
Footnote 1 Return to table footnote (1) referrer Cost data for Nunavut not available.
1/10 hourly wind pressure (Q10)
The following is a summary of changes projected in the values of this parameter as a consequence of climate change over the typical design life of buildings (50 years):
| Province or Territory | Number of Locations | ΔQ10 ≤ 0% | 0% < ΔQ10 ≤ 5% | 5% < ΔQ10 ≤ 10% | 10% < ΔQ10 ≤ 15% | ΔQ10 > 15% |
|---|---|---|---|---|---|---|
| Alberta | 55 | 0 | 26 | 29 | 0 | 0 |
| British Columbia | 108 | 0 | 15 | 48 | 45 | 0 |
| Manitoba | 24 | 0 | 10 | 14 | 0 | 0 |
| New Brunswick | 18 | 0 | 0 | 4 | 14 | 0 |
| Newfoundland | 18 | 0 | 0 | 8 | 10 | 0 |
| Nova Scotia | 25 | 0 | 0 | 11 | 14 | 0 |
| Northwest Territories | 17 | 0 | 5 | 12 | 0 | 0 |
| Nunavut | 16 | 0 | 11 | 5 | 0 | 0 |
| Ontario | 230 | 0 | 0 | 92 | 138 | 0 |
| Prince Edward Island | 4 | 0 | 0 | 2 | 2 | 0 |
| Quebec | 125 | 0 | 63 | 62 | 0 | 0 |
| Saskatchewan | 31 | 0 | 9 | 22 | 0 | 0 |
| Yukon | 9 | 0 | 9 | 0 | 0 | 0 |
| Total | 680 | 0 | 148 | 309 | 223 | 0 |
Across the 680 locations in NBC Table C-2, the projected changes in the values of this parameter over a 50-year future timeframe range from 3.5% to 12%. Since all locations are projected to have future increases in Q10, these increased values are applied as the future projected values. The 1-in-10 reference wind velocity pressure, Q10, is used for the determination of the wind-induced accelerations of buildings for serviceability (see the Commentary entitled Wind Load and Effects in the "Structural Commentaries (User's Guide – NBC 2020: Part 4 of Division B)"). The climate change factor for Q10 is similar to that for Q500 (and Q50); modest increases in building accelerations can be expected. Except for very tall buildings, acceptable accelerations will probably still be obtained without a significant change to structural design. For tall buildings that are very dynamically sensitive, the increase in Q10 may result in some additional structural costs to comply with serviceability criteria with respect to acceleration. Very dynamically sensitive tall buildings are required to be assessed through testing in a wind tunnel, which often allows significant optimization of the structure to be achieved.
1/50 hourly wind pressure (Q50)
The following is a summary of the changes projected in the values of this parameter as a consequence of climate change over the typical design life of buildings (50 years):
| Province or Territory | Number of Locations | ΔQ50 ≤ 0% | 0% < ΔQ50 ≤ 5% | 5% < ΔQ50 ≤ 10% | 10% < ΔQ50 ≤ 15% | ΔQ50 > 15% |
|---|---|---|---|---|---|---|
| Alberta | 55 | 0 | 55 | 0 | 0 | 0 |
| British Columbia | 108 | 0 | 23 | 85 | 0 | 0 |
| Manitoba | 24 | 0 | 24 | 0 | 0 | 0 |
| New Brunswick | 18 | 0 | 0 | 18 | 0 | 0 |
| Newfoundland | 18 | 0 | 0 | 18 | 0 | 0 |
| Nova Scotia | 25 | 0 | 0 | 25 | 0 | 0 |
| Northwest Territories | 17 | 0 | 17 | 0 | 0 | 0 |
| Nunavut | 16 | 0 | 16 | 0 | 0 | 0 |
| Ontario | 230 | 0 | 0 | 230 | 0 | 0 |
| Prince Edward Island | 4 | 0 | 0 | 4 | 0 | 0 |
| Quebec | 125 | 0 | 125 | 0 | 0 | 0 |
| Saskatchewan | 31 | 0 | 31 | 0 | 0 | 0 |
| Yukon | 9 | 0 | 9 | 0 | 0 | 0 |
| Total | 680 | 0 | 300 | 380 | 0 | 0 |
Across the 680 locations in NBC Table C-2, the projected changes in the values of this parameter over a 50-year future timeframe range from 5% to 10%. Since all locations are projected to have future increases in Q50, the increased values are applied as the future projected values. Where the increases are higher than 5%, the total deflection of the building may be affected in terms of serviceability and comfort; therefore, the design of the building would need to be verified with respect to increased wind loads and, where warranted, the stiffness of building structural systems would need to be increased to ensure compliance with the serviceability requirements in the NBC 2025. As well, the design of cladding and roofing systems would need to account for increased strength of their connections. The locations where there are increases in reference wind velocity pressure would likely have increases to the cost of the building structure of less than 5%. This, in turn, would increase the total construction cost by less than 0.5%. Considering that these projected cost increases would be more than offset by improved safety and the prevention of wind-related failures, such cost increases are entirely reasonable.
Cost impact on NBC Part 9 of updated 1/50 hourly wind pressure
Refer to "Cost impact of climatic load changes on Part 9: Future projected climate data for snow and wind loads (PCF 1979)" in the supporting document for PCF 1979 for the full cost analysis. A summary is reproduced here.
For structural sufficiency of glass (NBC Sentence 9.6.1.3.(2)), a 128.5 m2, 2-storey detached home, which contained five differently sized windows with glass areas between 0.57 m2 and 1.43 m2, was used as the archetype. In 649 of the 680 locations in NBC Table C-2, the 1-in-50 hourly wind pressures remained below the maximum limits provided in NBC Tables 9.6.1.3.-A, 9.6.1.3.-B and 9.6.1.3.-C before and after the change, resulting in no impact. In 3 of the 31 locations with a potential impact—Cowley, AB; Cape Race, NL; and Resolution Island, NU—the 1-in-50 hourly wind pressure before and after the proposed change exceeded the maximum value of 1.0 kPa provided in the prescriptive table in the NBC; this would require consultation with the window manufacturer for glass thickness and would likely have a cost impact. For the remaining 28 locations, there would be an increased cost for windows of $126.98 to $353.51.
For nailing of framing (nailing of roof trusses, rafters and joists to wall framing; NBC Sentence 9.23.3.4.(3)), a 120 m2 bungalow was used as the archetype. Due to the proposed change, 6 new locations—Argentia, NL; Channel-Port aux Basques, NL; Grand Bank, NL; St. John's, NL; Wabana, NL; and Nottingham Island, NU—will have 1-in-50 hourly wind pressures that are equal to or exceed 0.8 kPa, and roof trusses, rafters or joists would be required to be tied to wall framing with connectors that can resist 3 kN of roof uplift. For 6 these locations, the number of galvanized steel connectors required was calculated to be approximately 72, resulting in a cost increase of $437.04.
For fasteners for sheathing (NBC Article 9.23.3.5.), a 128.5 m2, 2-storey detached house was used as the archetype. In 667 of the 680 locations in NBC Table C-2, the 1-in-50 hourly wind pressures remained below 0.8 kPa, resulting in no impact. Seven of the 13 remaining locations already have a 1-in-50 hourly wind pressure greater than 0.8 kPa in the current NBC Table C-2, resulting in no impact. The same 6 locations noted above will have 1-in-50 hourly wind pressures that exceed 0.8 kPa due to the proposed change, resulting in the following impacts:
- For roof sheathing, the 6 new locations would require larger fasteners and fasteners spaced at 50 mm within 1 m of the roof edge. The cost increase using common wire nails was estimated to be $468.68 for each location.
- For wall sheathing, the 6 new locations would require braced wall panels with wood-based wall sheathing, resulting in a cost increase of $1,125.30 for each location.
For anchorage of building frames (NBC Sentence 9.23.6.1.(3)), the same 6 new locations noted above will have 1-in-50 hourly wind pressures that exceed 0.8 kPa, resulting in an increase in the number of anchor bolts by 15 for a total cost increase of $94.20.
For required roof sheathing (NBC Sentence 9.23.16.1.(1)), a 128.5 m2 2-storey detached bungalow was used as the archetype. The same 6 locations noted above would be impacted by the proposed change and be required to meet Subsection 9.23.16. The cost increase for going from a sheathing deemed too thin for truss spacing in NBC Sentence 9.23.16.7.(2) to a compliant plywood sheathing was approximately $168.82.
For lumber roof sheathing (NBC Article 9.23.16.5.), the roof area of a 128.5 m2 2-storey detached house was used as the archetype. The same 6 locations noted above would be impacted by the proposed change and be required to have lumber roof sheathing installed diagonally instead of horizontally, per NBC Sentence 9.23.16.5., resulting in a cost increase of approximately $311.67 for each location.
For the attachment of cladding to flat insulating concrete form (ICF) wall units (NBC Sentence 9.27.5.4.(2)), a 128.5 m2 2-storey detached house was used as the archetype. In 612 of the 680 locations in NBC Table C-2, the 1-in-50 hourly wind pressure is equal to or less than 0.6 kPa before and after the proposed change, resulting in no impact. In 34 of the remaining 68 locations, the 1-in-50 hourly wind pressure is greater than 0.6 kPa before and after the proposed change, so the impact is assumed to be minimal and would account for additional fasteners. The greatest impact would be experienced where the 1-in-50 hourly wind pressure increases from equal to or less than 0.60 kPa to more than 0.6 kPa after the proposed change, which occurs in the remaining 34 locations. This resulted in an approximate cost increase of $2,009.15 in these locations, representing the different material costs for fasteners into concrete, the additional labour, and the reduced daily output to attach the furring through the flat ICF wall units into the solid concrete back-up wall.
1/50 snow load Ss (Ss50)
The following is a summary of the changes projected in the values of this parameter as a consequence of climate change over the typical design life of buildings (50 years):
| Province or Territory | Number of Locations | ΔSs50 < 0% | ΔSs50 = 0% | 0% < ΔSs50 ≤ 2% | 2% < ΔSs50 < 5% | ΔSs50= 5% |
|---|---|---|---|---|---|---|
| Alberta | 55 | 0 | 55 | 0 | 0 | 0 |
| British Columbia | 108 | 0 | 108 | 0 | 0 | 0 |
| Manitoba | 24 | 0 | 24 | 0 | 0 | 0 |
| New Brunswick | 18 | 0 | 18 | 0 | 0 | 0 |
| Newfoundland | 18 | 0 | 18 | 0 | 0 | 0 |
| Nova Scotia | 25 | 0 | 25 | 0 | 0 | 0 |
| Northwest Territories | 17 | 0 | 0 | 0 | 0 | 17 |
| Nunavut | 16 | 0 | 0 | 0 | 0 | 16 |
| Ontario | 230 | 0 | 230 | 0 | 0 | 0 |
| Prince Edward Island | 4 | 0 | 4 | 0 | 0 | 0 |
| Quebec | 125 | 0 | 125 | 0 | 0 | 0 |
| Saskatchewan | 31 | 0 | 31 | 0 | 0 | 0 |
| Yukon | 9 | 0 | 0 | 0 | 0 | 9 |
| Total | 680 | 0 | 638 | 0 | 0 | 42 |
Across the 680 locations in NBC Table C-2, the projected changes in the values of this parameter over a 50-year future timeframe range from 0% to 5%. All 638 locations in the provinces of Alberta, British Columbia, Manitoba, New Brunswick, Newfoundland, Nova Scotia, Ontario, Prince Edward Island, Quebec and Saskatchewan are projected to have no change in Ss50 in the future; accordingly, the design values for these locations remain the same as the current values. For the remaining 42 locations in the Northwest Territories, Nunavut and Yukon, a future increase in snow loads of 5% is projected and, as such, the future projected values are the recommended design values for those locations. Although the projected increase in snow loading in the North is greater than 4%, it is anticipated that this proposed change will have a negligible effect on total building costs in the future.
1/50 snow load Sr (Sr50)
The following is a summary of the changes projected in the values of this parameter as a consequence of climate change over the typical design life of buildings (50 years):
| Province or Territory | Number of Locations | ΔSr50 < 0% | ΔSr50 = 0% | 0% < ΔSr50 ≤ 2% | 2% < ΔSr50 < 5% | ΔSr50= 5% |
|---|---|---|---|---|---|---|
| Alberta | 55 | 0 | 55 | 0 | 0 | 0 |
| British Columbia | 108 | 0 | 108 | 0 | 0 | 0 |
| Manitoba | 24 | 0 | 24 | 0 | 0 | 0 |
| New Brunswick | 18 | 0 | 18 | 0 | 0 | 0 |
| Newfoundland | 18 | 0 | 18 | 0 | 0 | 0 |
| Nova Scotia | 25 | 0 | 25 | 0 | 0 | 0 |
| Northwest Territories | 17 | 0 | 0 | 0 | 0 | 17 |
| Nunavut | 16 | 0 | 0 | 0 | 0 | 16 |
| Ontario | 230 | 0 | 230 | 0 | 0 | 0 |
| Prince Edward Island | 4 | 0 | 4 | 0 | 0 | 0 |
| Quebec | 125 | 0 | 125 | 0 | 0 | 0 |
| Saskatchewan | 31 | 0 | 31 | 0 | 0 | 0 |
| Yukon | 9 | 0 | 0 | 0 | 0 | 9 |
| Total | 680 | 0 | 638 | 0 | 0 | 42 |
Across the 680 locations in NBC Table C-2, the projected changes in the values of this parameter over a 50-year future timeframe range from 0% to 5%. All 638 locations in the provinces of Alberta, British Columbia, Manitoba, New Brunswick, Newfoundland, Nova Scotia, Ontario, Prince Edward Island, Quebec and Saskatchewan are projected to have no change in Sr50 in the future; accordingly, the design values for these locations remain the same as the current values. For the remaining 42 locations in the Northwest Territories, Nunavut and Yukon, a future increase in snow loads of 5% is projected and, as such, the future projected values are the recommended design values for those locations. Although the projected increase in snow loading in the North is higher than 4%, it is anticipated that this proposed change will have a negligible effect on total building costs in the future.
Cost impact on NBC Part 9 of updated 1/50 snow loads
Refer to "Cost impact of climatic load changes on Part 9: Future projected climate data for snow and wind loads (PCF 1979)" in the supporting document for PCF 1979 for the full cost analysis. A summary is reproduced here.
For platforms subject to snow and occupancy loads (NBC Sentence 9.4.2.3.(1)), a 3.5 m by 4 m exterior platform was assessed as the archetype. Of the 42 locations impacted by the updated 1/50 snow loads, 29 locations had specified snow loads less than 1.9 kPa before and after the proposed change, resulting in no impact. Of the 13 remaining locations, 6 locations had specified snow loads that remained within the same range before and after the proposed change, resulting in no impact. Of the 7 remaining locations, using the archetype, span tables, and costs from RSMeans, only 2 locations had a cost increase—$47.77 in Tungsten, NT, and $126.43 in Kugluktuk/Coppermine, NU.
For performance of windows, doors and skylights (NBC Sentence 9.7.3.1.(2)), the magnitude of the cost impact could not be determined without industry knowledge of the structural design of skylights, including the capacity of the skylight frames and glazing.
For columns (NBC Sub 9.17.1.1.(1)(b)(ii)), a 2.44 m by 4 m exterior platform that is raised 3 m from the ground by 3 columns was assessed. In 41 of the 42 locations impacted by the updated 1/50 snow loads, the sum of the specified snow load and the occupancy load remained below 4.8 kPa before and after the proposed change, resulting in no impact. It was found that there was no change in cost in the last location—Resolution Island, NU—as the same column size was applicable before and after the change.
For ridge support (NBC Sentence 9.23.14.8.(5) and NBC Table 9.23.14.8.), a 120 m2 bungalow was used as the archetype. In 32 of the 42 locations impacted by the updated 1/50 snow loads, the specified snow load remained within the same range before and after the proposed change, resulting in no impact. Of the 10 remaining locations, 3 were not impacted because the same number of nails were sufficient before and after the proposed change. In the 7 remaining locations, the maximum number of additional nails required was 3 nails, resulting in an additional material cost of $5.45 in Eureka, NU.
For ICF lintels (NBC Sentence 9.20.17.4.(3) and NBC Span Tables 9.20.17.4.-A, 9.20.17.4.-B and 9.20.17.4.-C), an approximately 120 m2 bungalow was used as the archetype, assuming 150 mm thick ICF walls. ICF lintel sizes before and after the proposed change were analyzed where the ground snow load exceeded 3.33 kPa. In 31 of the 42 locations impacted by the updated 1/50 snow loads, the ICF lintel size was sufficient to support the snow load before and after the proposed change, resulting in no impact. In Resolution Island, NU, the ground snow load exceeded both those listed in the NBC span tables and those provided by an ICF manufacturer and will likely require a structural engineer to design using NBC Part 4 with additional material and labour costs. For the 10 remaining locations in the Yukon, Northwest Territories and Nunavut, there was an increased cost for ICF lintels of $6.71 to $32.63.
For spans for joists, rafters and beams (NBC Sentence 9.23.4.2.(1)), an approximately 120 m2 bungalow was used as the archetype. In 38 of the 42 locations impacted by the updated 1/50 snow loads, the specified snow load before and after the proposed change remained within the same range, resulting in no impact. The impacts on the remaining 4 locations—Fort Smith, NT; Tungsten, NT; Eureka, NU; and, Kugluktuk, NU—are as follows:
- For roof joists (NBC Span Tables 9.23.4.2.-D and 9.23.4.2.-E), there was no impact in Fort Smith, NT, and Tungsten, NT, because the same roof joist size was sufficient before and after the proposed change. The cost increase in Eureka, NU, and Kugluktuk, NU, was approximately $1,850.00.
- For roof rafters (NBC Span Tables 9.23.4.2.-F and 9.23.4.2.-G), there was no impact in Kugluktuk, NU because the size of the roof rafters was sufficient before and after the proposed change. There was a cost increase of $255.30 to $1,342.89 in the 3 remaining locations.
- For built-up ridge beams and lintels supporting the roof (NBC Span Table 9.23.4.2.-L), there was no impact in Tungsten, NT, because the size of the built-up ridge beam was sufficient before and after the proposed change. There was a cost increase of $140.24 to $262.66 in the 3 remaining locations.
- For lintels of various wood species (NBC Span Tables 9.23.12.3.-A, 9.23.12.3.-B, 9.23.12.3.-C and 9.23.12.3.-D), there was a cost increase in all 4 locations of $32.13 to $84.47.
Uniform hazard vs. uniform risk
The introduction of new data for snow and wind loads reflects a change in the approach used to assess reliability in NBC Part 4 from "uniform hazard" to "uniform risk":
- New specified wind and snow load values are proposed that reflect a uniform risk by reducing the current load factors of 1.4 and 1.5, respectively, to 1.0 and by using 500-year recurrence wind loads and 1000-year recurrence snow loads.
- New parameters, winter average temperature and wind speed, are introduced (for snow drifting calculations on roofs).
The impacts of these changes are addressed in PCF 1980, which incorporates proposed climate-related changes in NBC Part 4, including the uniform risk approach.
Most importantly, this new approach will provide a more uniform level of safety across the country, depending on the site-specific climate, that accounts for climate projections over a 50-year horizon but keeps the same target level of safety (currently, a probability of failure of 0.001 during the 50-year assumed service life). In addition, this will harmonize the approach used for climatic loads with the approach used for seismic effects (2475-year recurrence of design earthquake).
Overall, the proposed changes to NBC Table C-2 will result in buildings with a lower risk of failure during their entire service compared to past practice. While the changes in some locations may seem significant, the proposed approach remains reasonably simple and is not disruptive to the current practice.
In most cases, it is expected that common construction methods, material spacings and design considerations would prove to be resilient enough that no significant additional measures or costs would be needed to satisfy the engineering design resulting from the shift to the proposed uniform risk approach and climate change factors.
Enforcement implications
Who is affected
Designers, architects, building regulators and building owners.
Supporting Document(s)
OBJECTIVE-BASED ANALYSIS OF NEW OR CHANGED PROVISIONS
- Date modified: